
How to Use
Step-by-step guide for building and backtesting a strategy with the AlgoAlpha Strategy Builder.
This guide walks you through building your first strategy with the Backtest Strategy Builder, from initial setup to interpreting the results.
Step 1 — Prepare Your Chart
Before using the Strategy Builder, add the AlgoAlpha indicators whose signals you want to test:
- Open a chart on any asset and timeframe in TradingView
- Add one or more AlgoAlpha indicators:
- Smart Signals Assistant — for trend, reversal, and scalping signals
- ILPAC — for BOS, CHoCH, and FOMO Bubble events
- Momentum Concepts — for oscillator reversals, zero-line crosses, and divergences
- Ensure the indicators are loaded and displaying on your chart
The Strategy Builder reads signals from the other AlgoAlpha indicators on the same chart. If an indicator is not present, its signals will not be available as conditions.
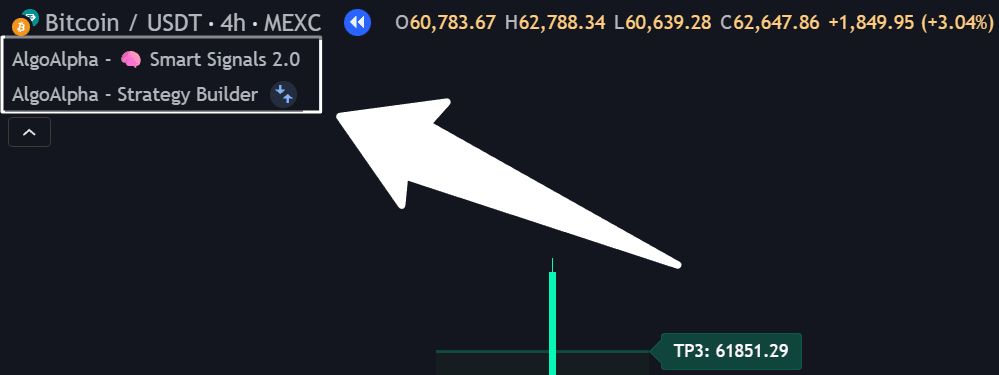
Step 2 — Add the Strategy Builder
- Click the Indicators button in TradingView's toolbar
- Select the Invite-only scripts tab
- Find and add Backtest Strategy Builder
- The strategy will appear on your chart, and the Strategy Tester tab will become available at the bottom of the screen
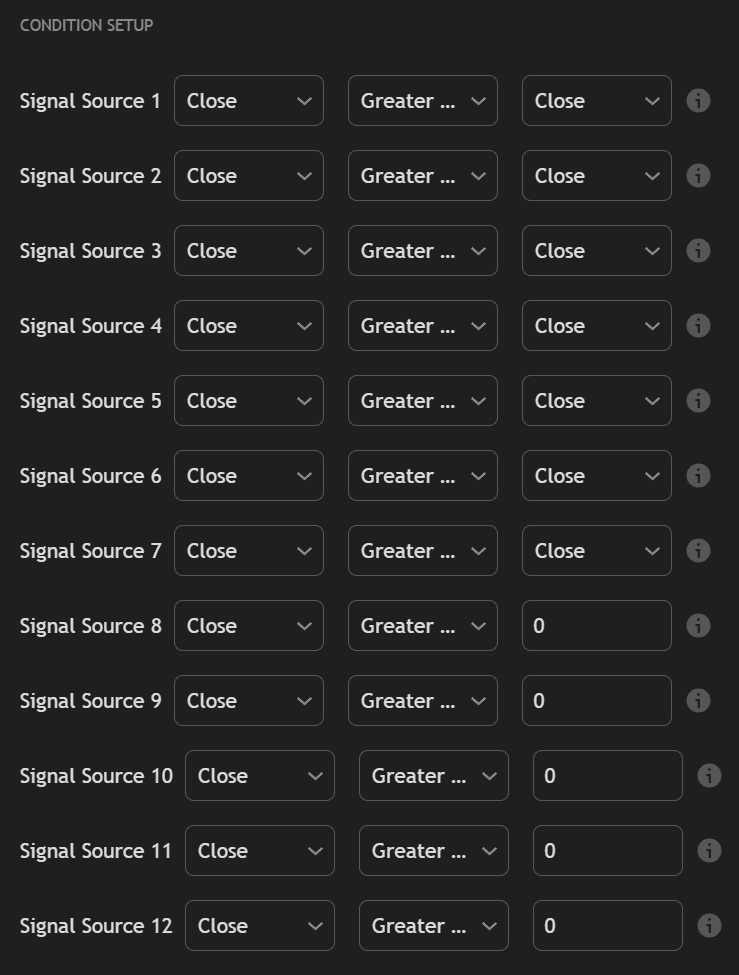
Step 3 — Configure Entry Conditions
Open the Strategy Builder's settings (gear icon) and navigate to the entry conditions section.
Selecting Signals
Choose which events trigger a trade entry. For example:
- SSA Long Signal — enter long when Smart Signals Assistant generates a bullish signal
- ILPAC Bullish BOS — enter long when a bullish Break of Structure is detected
- MC Fast Oscillator Reversal — enter long when the Fast Oscillator reverses from oversold
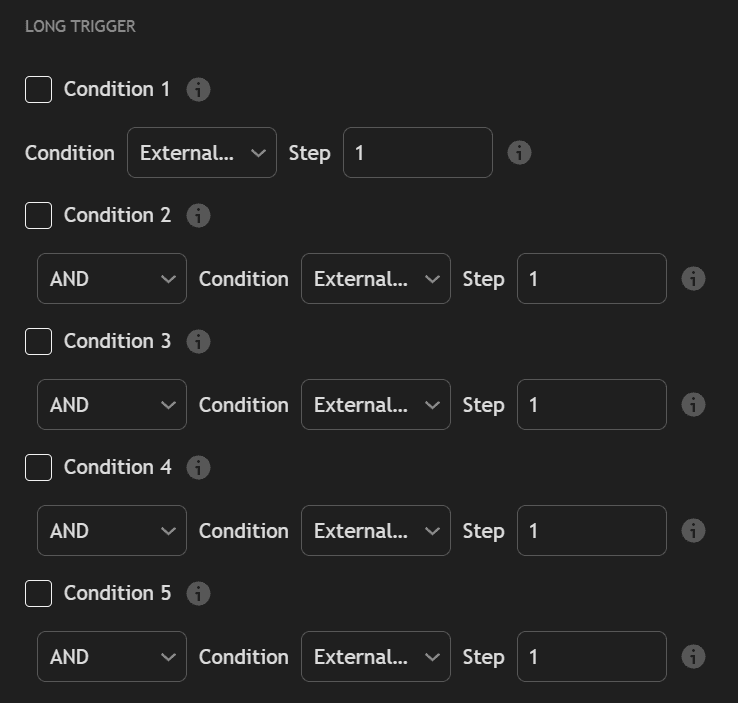
Applying Logic Operators
You can combine multiple conditions using AND/OR logic:
| Logic | Behavior |
|---|---|
| AND | All selected conditions must be true on the same bar to trigger an entry |
| OR | Any one of the selected conditions being true triggers an entry |
For example:
- SSA Long Signal AND ILPAC Bullish BOS — only enters when both signals fire on the same bar (higher selectivity, fewer trades)
- SSA Long Signal OR MC Reversal — enters when either signal fires (lower selectivity, more trades)
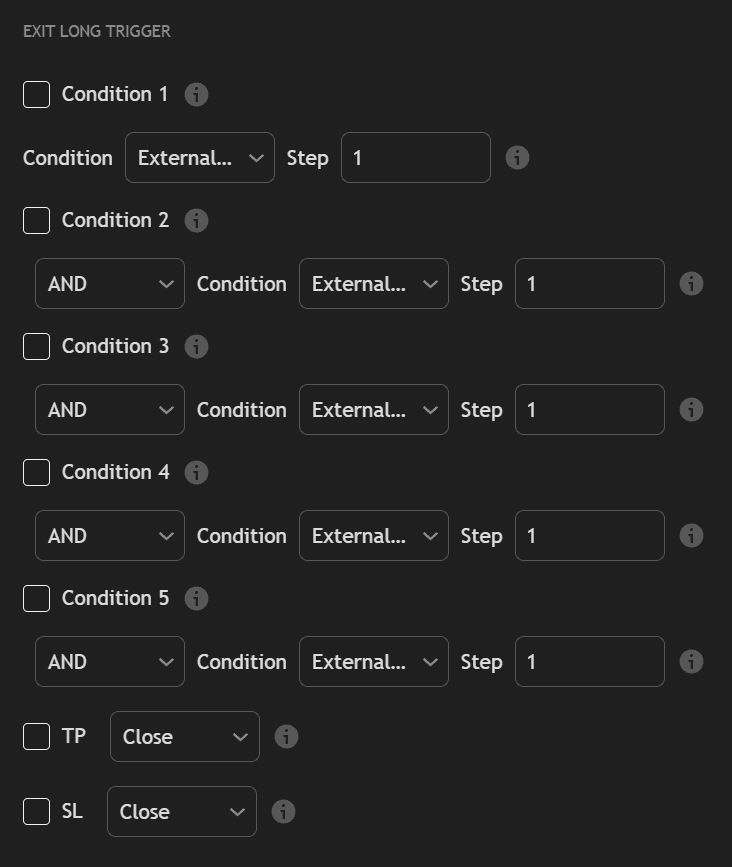
Step 4 — Configure Exit Conditions
Define how and when positions are closed:
| Exit Type | Description |
|---|---|
| Take Profit (%) | Close the position when unrealized profit reaches a specified percentage |
| Stop Loss (%) | Close the position when unrealized loss reaches a specified percentage |
| Signal-based exit | Close when an opposing signal fires (e.g., a bearish signal closes a long position) |
| Time-based exit | Close the position after a specified number of bars |
| Trailing stop | A stop-loss that moves in the trade's favor as price advances |
You can combine multiple exit conditions — the position closes when any one of them triggers.
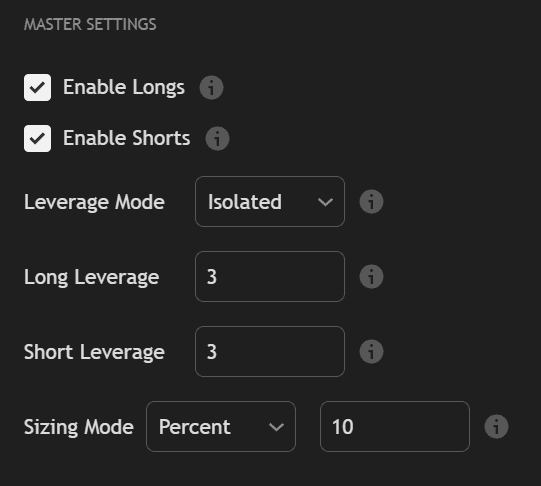
Step 5 — Set Trade Parameters
Configure realistic trading conditions:
| Parameter | Description |
|---|---|
| Initial Capital | The starting account balance for the simulation |
| Position Size | How much capital to allocate per trade (fixed amount, percentage of equity, or contracts) |
| Leverage | The leverage multiplier (1x for no leverage, up to your preferred level) |
| Commission | Per-trade fee as a percentage or fixed amount |
| Slippage | Estimated price slippage per trade in ticks or percentage |
Always include realistic commission and slippage values. A strategy that looks profitable with zero costs may break even or lose money after fees are accounted for.
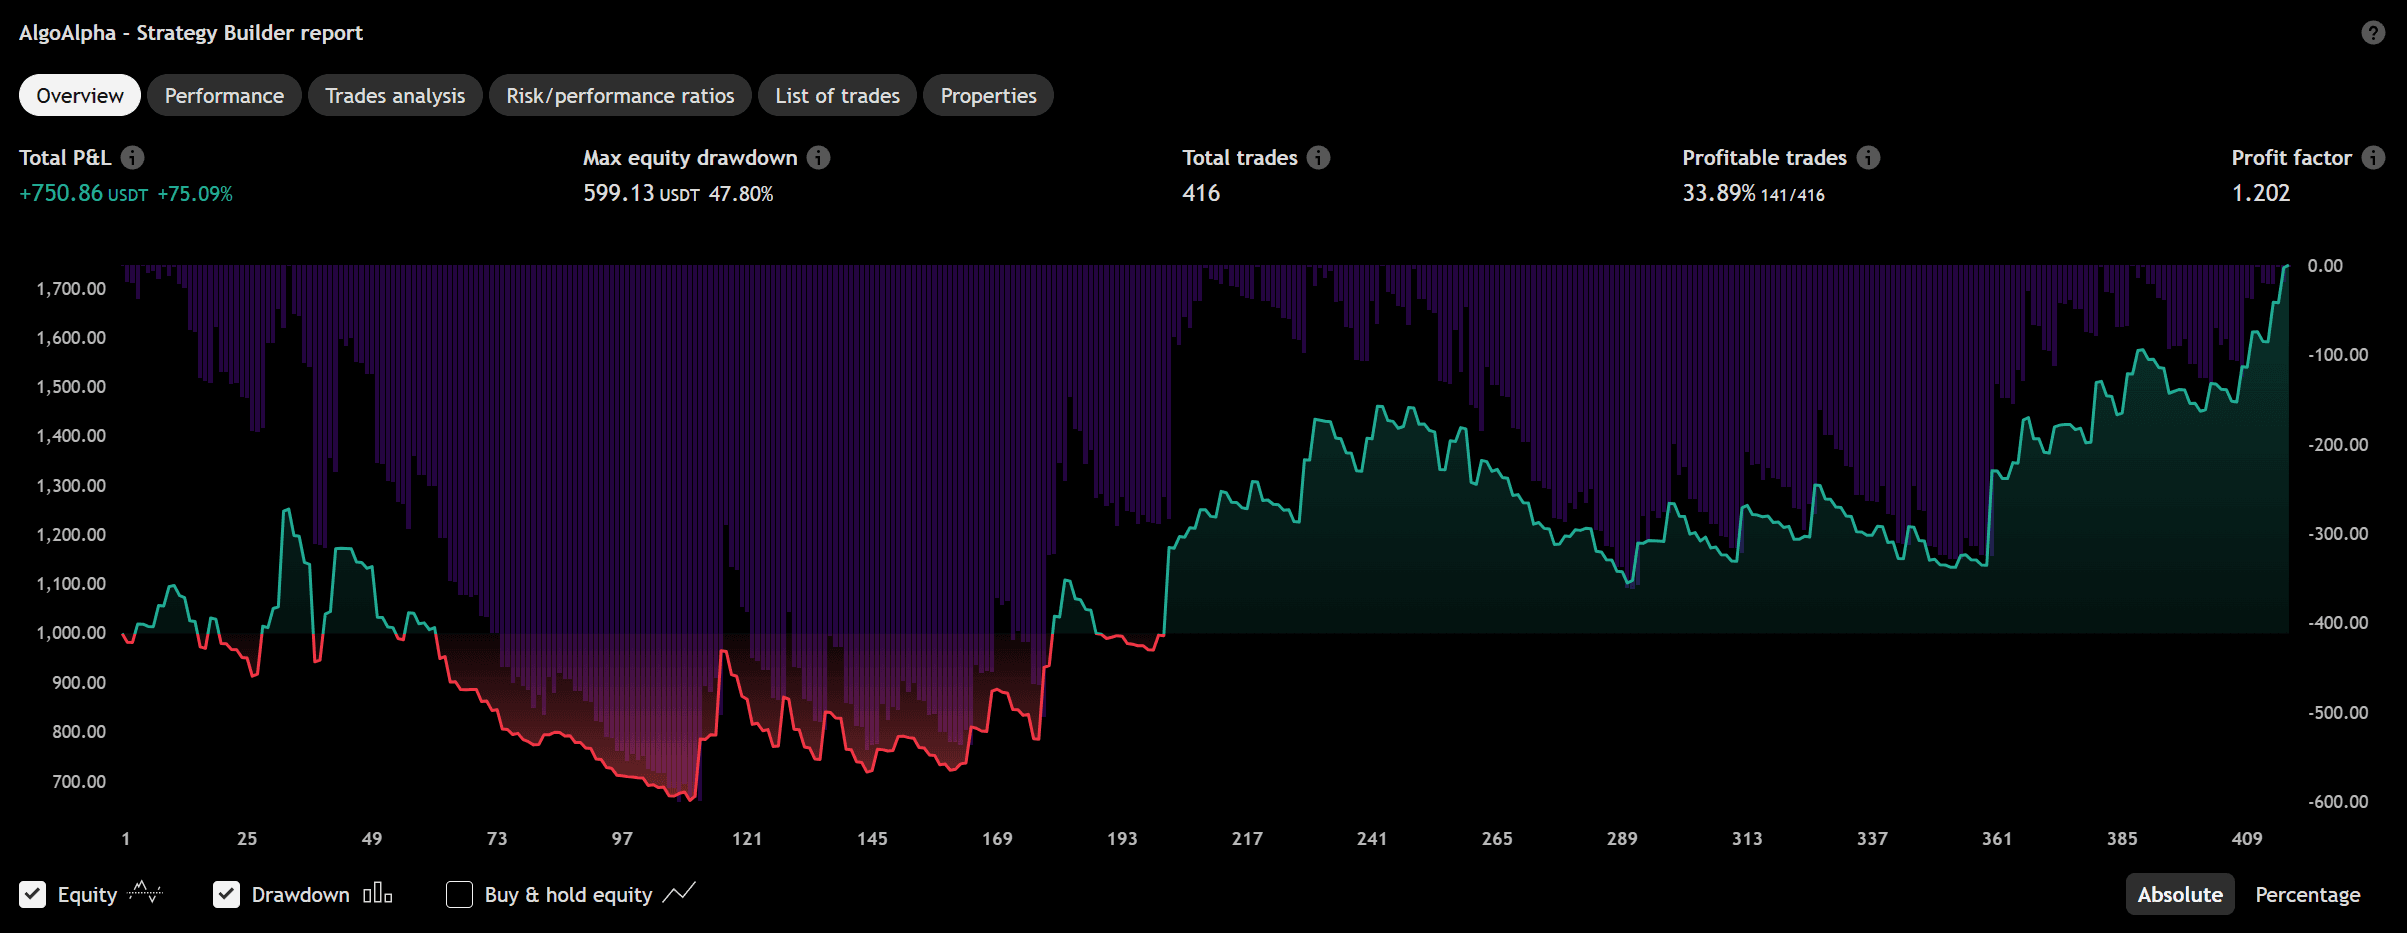
Step 6 — Review the Results
After configuring all settings, the Strategy Tester tab at the bottom of TradingView displays:
Performance Summary
| Metric | What It Tells You |
|---|---|
| Net Profit | Total profit or loss after all trades, commissions, and slippage |
| Win Rate | Percentage of trades that were profitable |
| Profit Factor | Ratio of gross profit to gross loss (above 1.0 means profitable overall) |
| Max Drawdown | The largest peak-to-trough decline in equity during the test period |
| Sharpe Ratio | Risk-adjusted return — higher values indicate better return per unit of risk |
| Total Trades | Number of trades executed during the simulation |
| Average Trade | Average profit or loss per trade |
Equity Curve
A visual chart showing how the account equity changed over time. Look for:
- Steadily rising curve — consistent profitability
- Large drawdowns — periods of significant loss that may exceed your risk tolerance
- Flat periods — times when the strategy was not active or breaking even
Trade List
A detailed log of every trade the strategy executed, including entry/exit prices, profit/loss, and the signals that triggered each trade.
Step 7 — Iterate and Optimize
Based on the results, adjust your strategy:
- Too few trades? — Loosen conditions (use OR instead of AND, or add more signal types)
- Too many losing trades? — Tighten conditions (use AND, add filters, or increase signal selectivity)
- Large drawdowns? — Reduce position size, add a tighter stop loss, or filter trades by trend direction
- Good on one asset, bad on others? — The strategy may be overfit; test across multiple symbols and timeframes
Backtest Strategy Builder
Overview of the Strategy Builder — a no-code backtesting engine for TradingView that lets you combine AlgoAlpha signals with AND/OR logic and run full P&L simulations.
Practical Example
A worked example showing how to build, backtest, and evaluate a trading strategy using the AlgoAlpha Strategy Builder.