
Practical Example
A worked example showing how to build, backtest, and evaluate a trading strategy using the AlgoAlpha Strategy Builder.
This page walks through a complete example of building a strategy from scratch, running the backtest, and interpreting the results. The goal is to demonstrate the full workflow so you can apply the same process to your own strategy ideas.
The Strategy Idea
We will build a simple trend-following strategy that enters long positions when both the Smart Signals Assistant (SSA) and ILPAC agree that bullish momentum is present, and exits using a combination of a take-profit target and a trailing stop-loss.
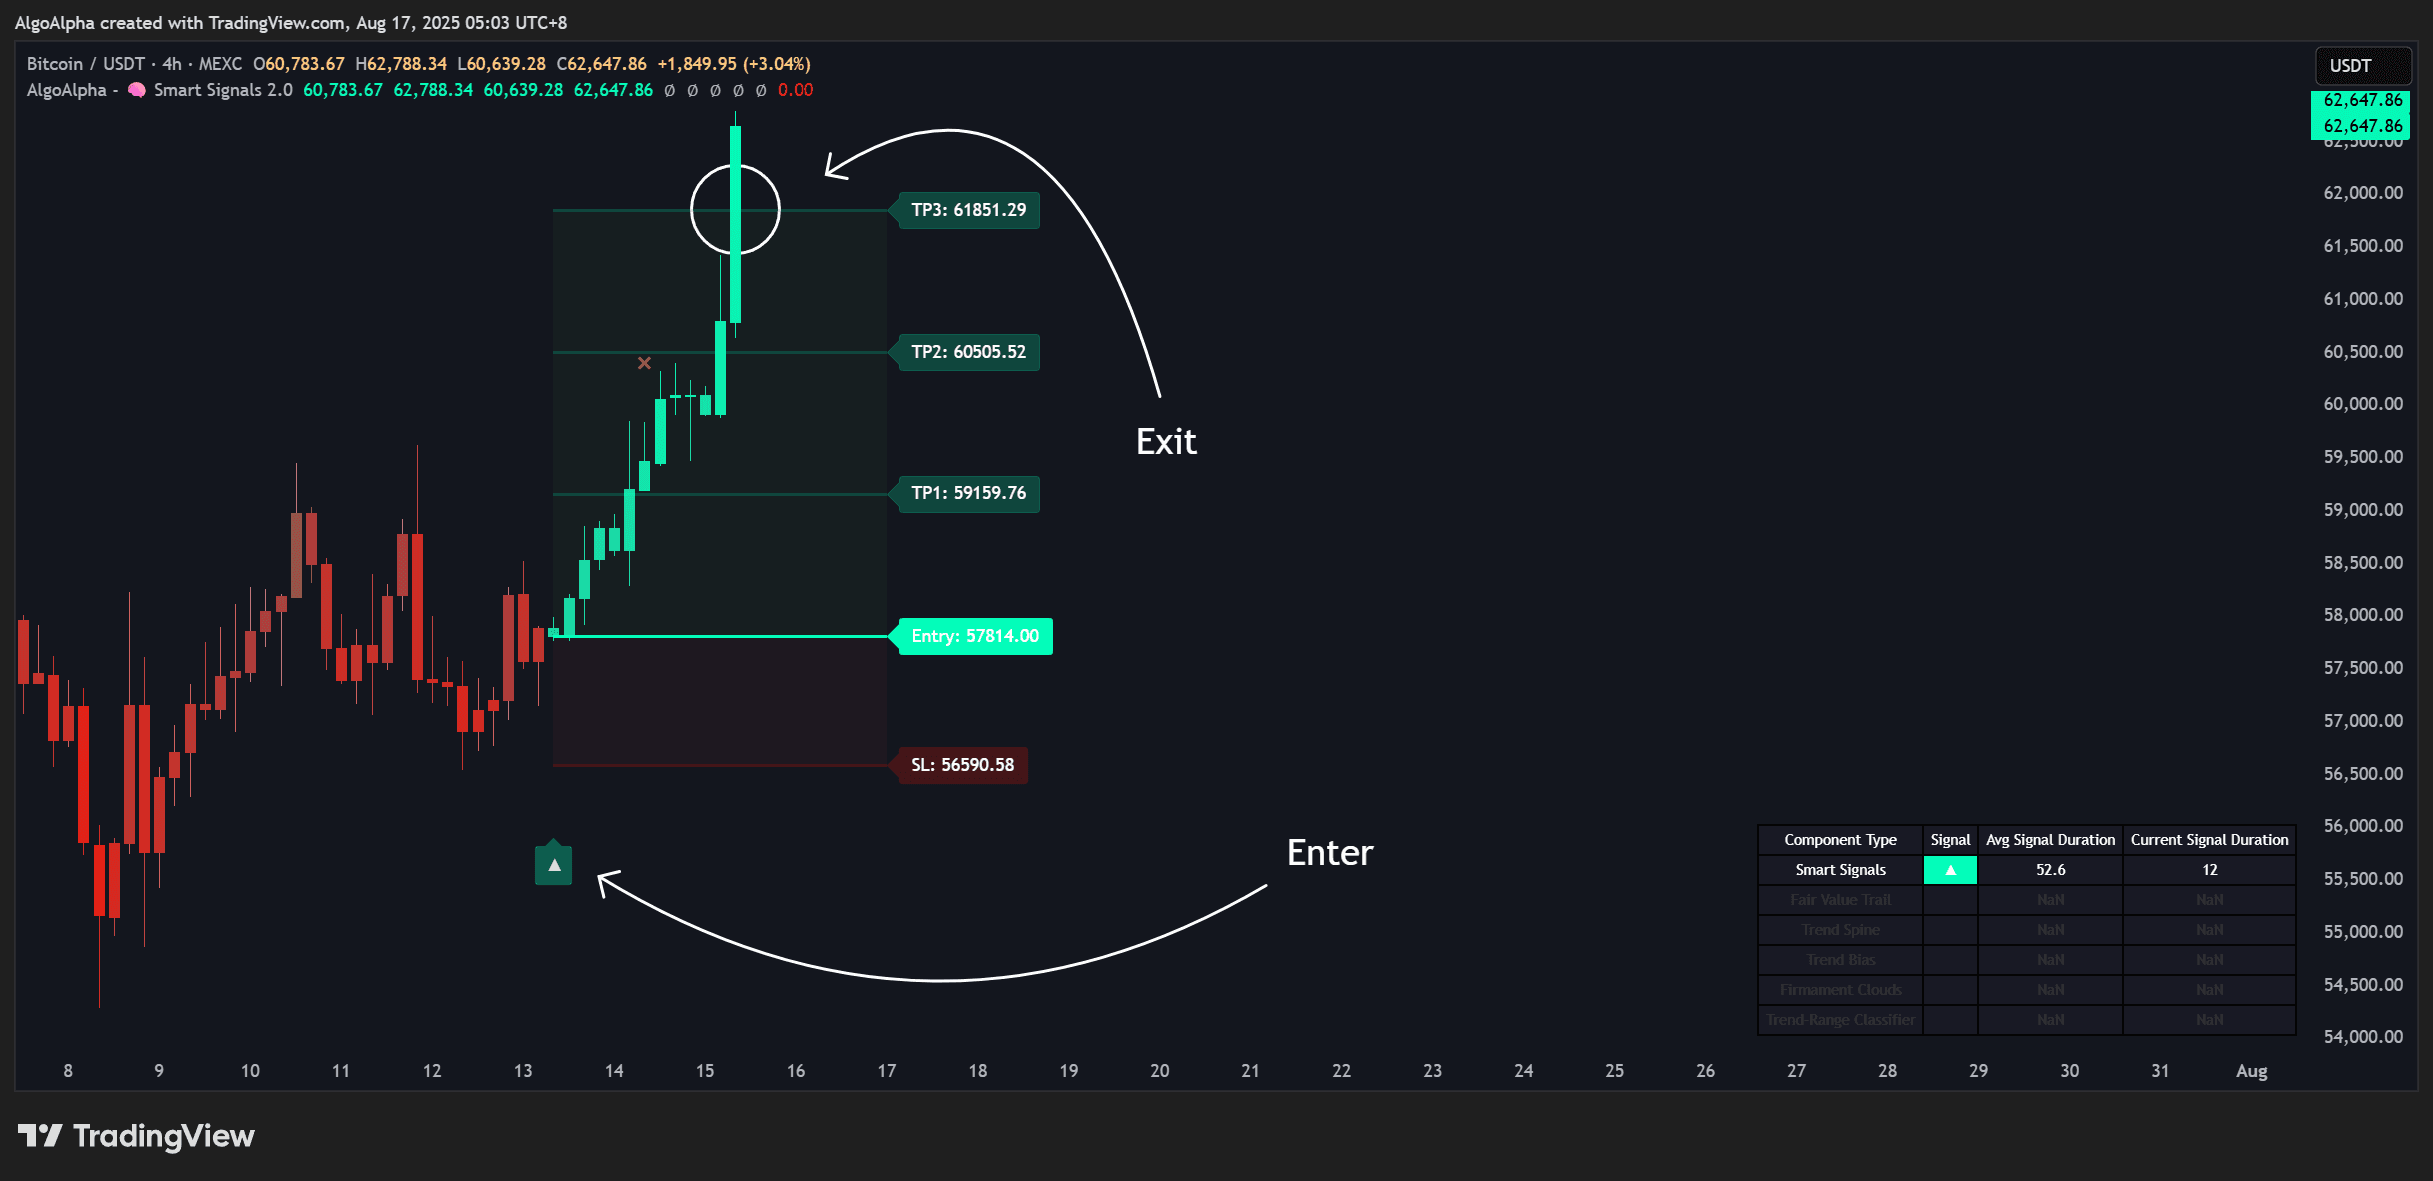
Entry rule: SSA generates a long signal AND ILPAC confirms a bullish BOS on the same bar.
Exit rules:
- Take profit at 3%
- Trailing stop-loss at 1.5%
- Exit if SSA generates a short signal
Step 1 — Chart Setup
- Open TradingView and load a chart for BTCUSDT on the 4-hour timeframe
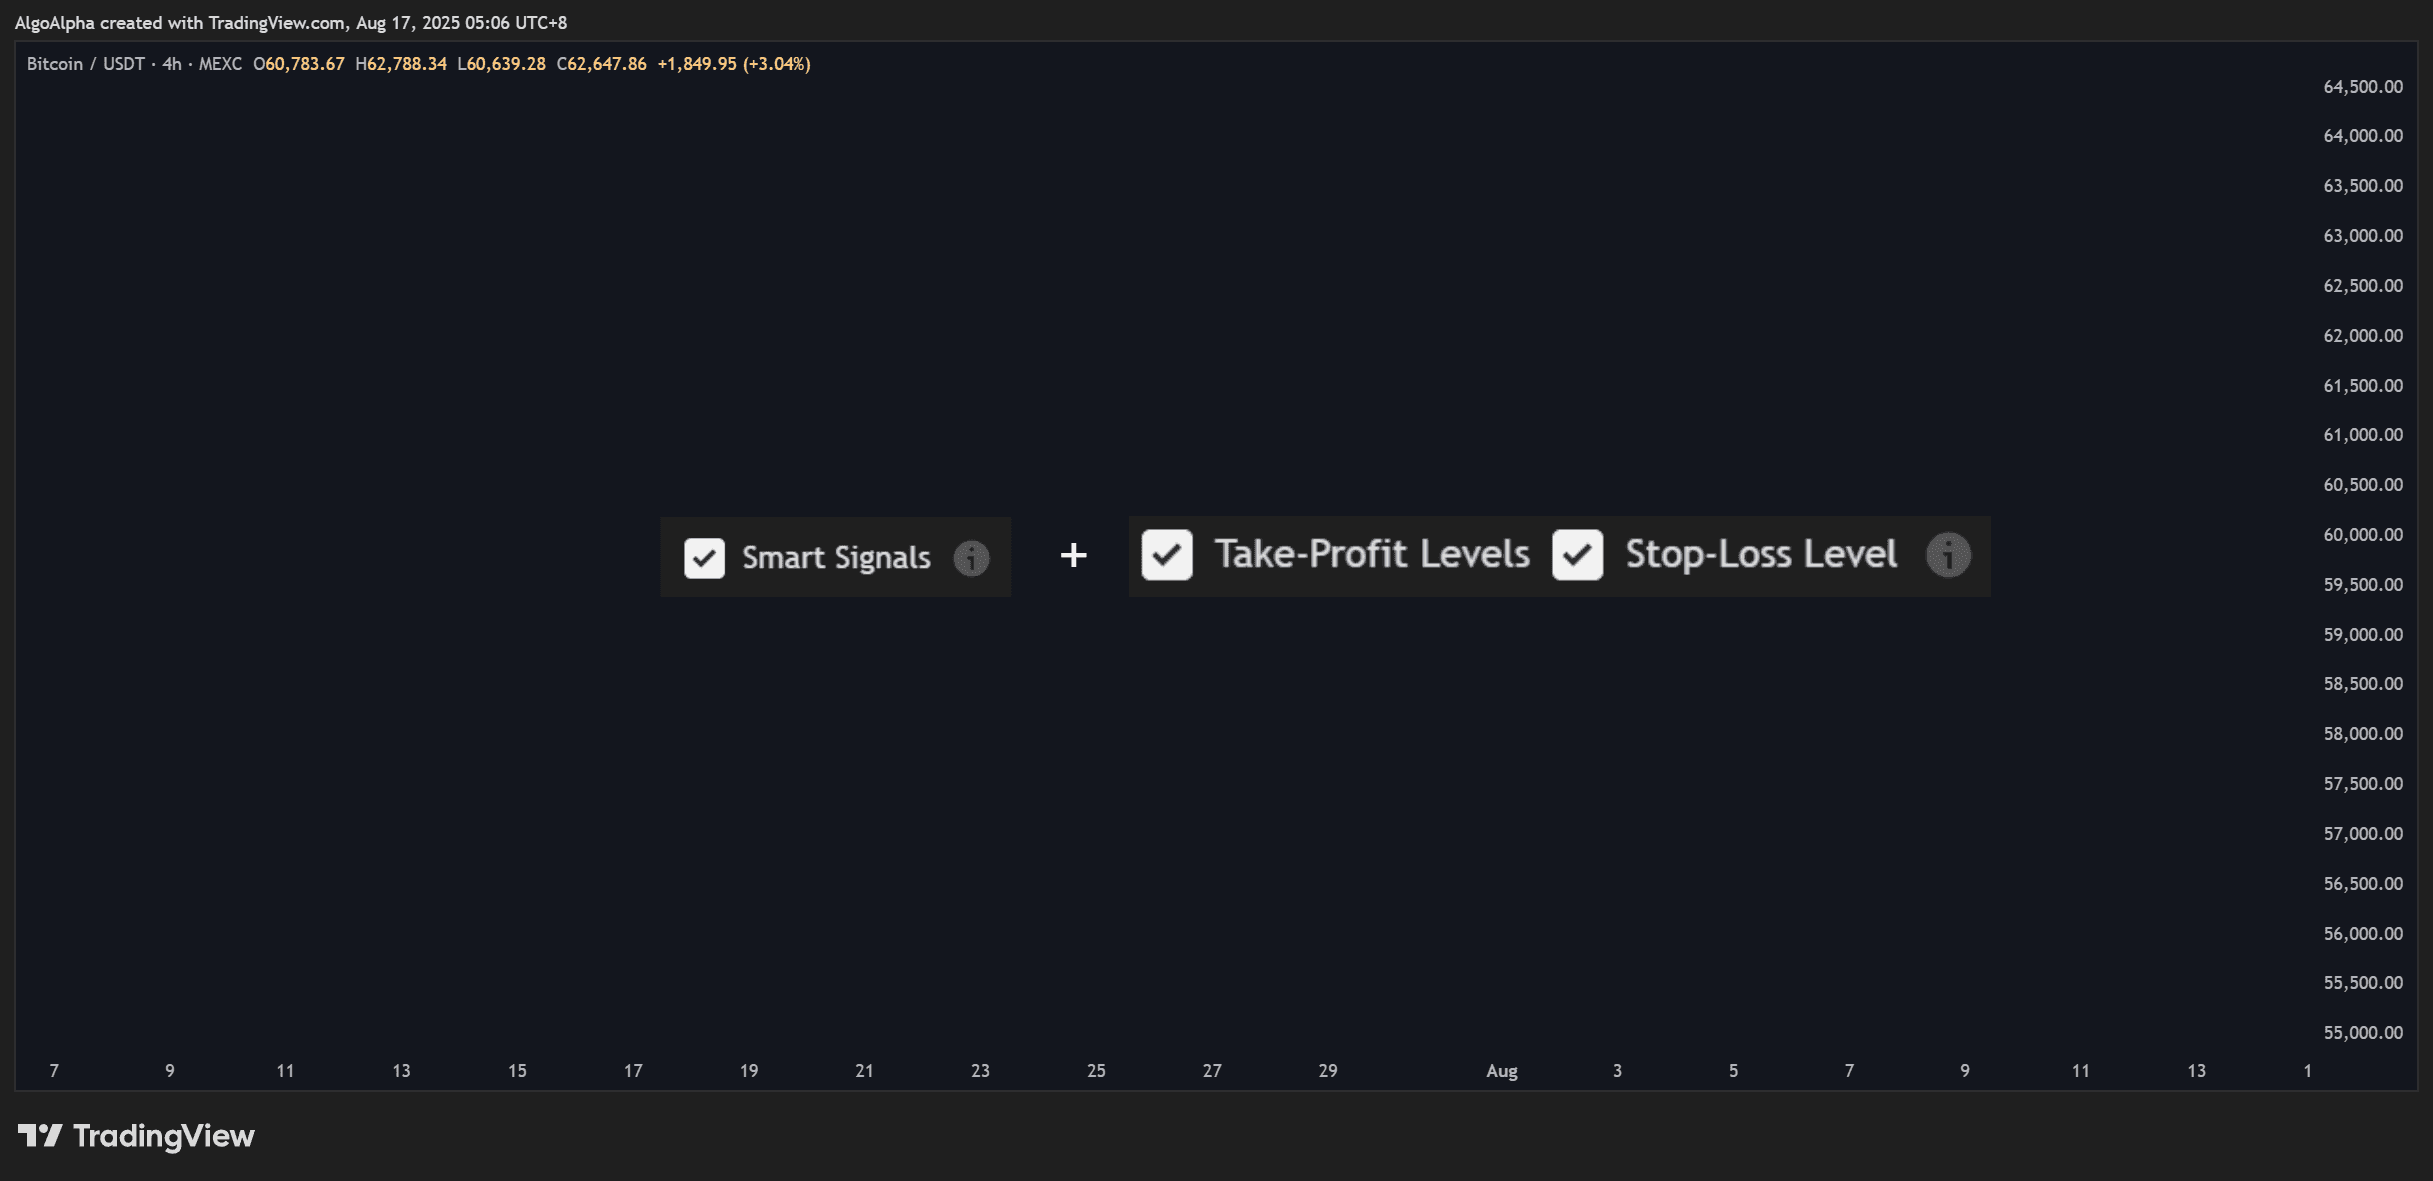
- Add Smart Signals Assistant to the chart
- Add ILPAC to the chart
- Add the Backtest Strategy Builder
Ensure all three scripts are loaded and visible before proceeding.
Step 2 — Configure Entry Conditions
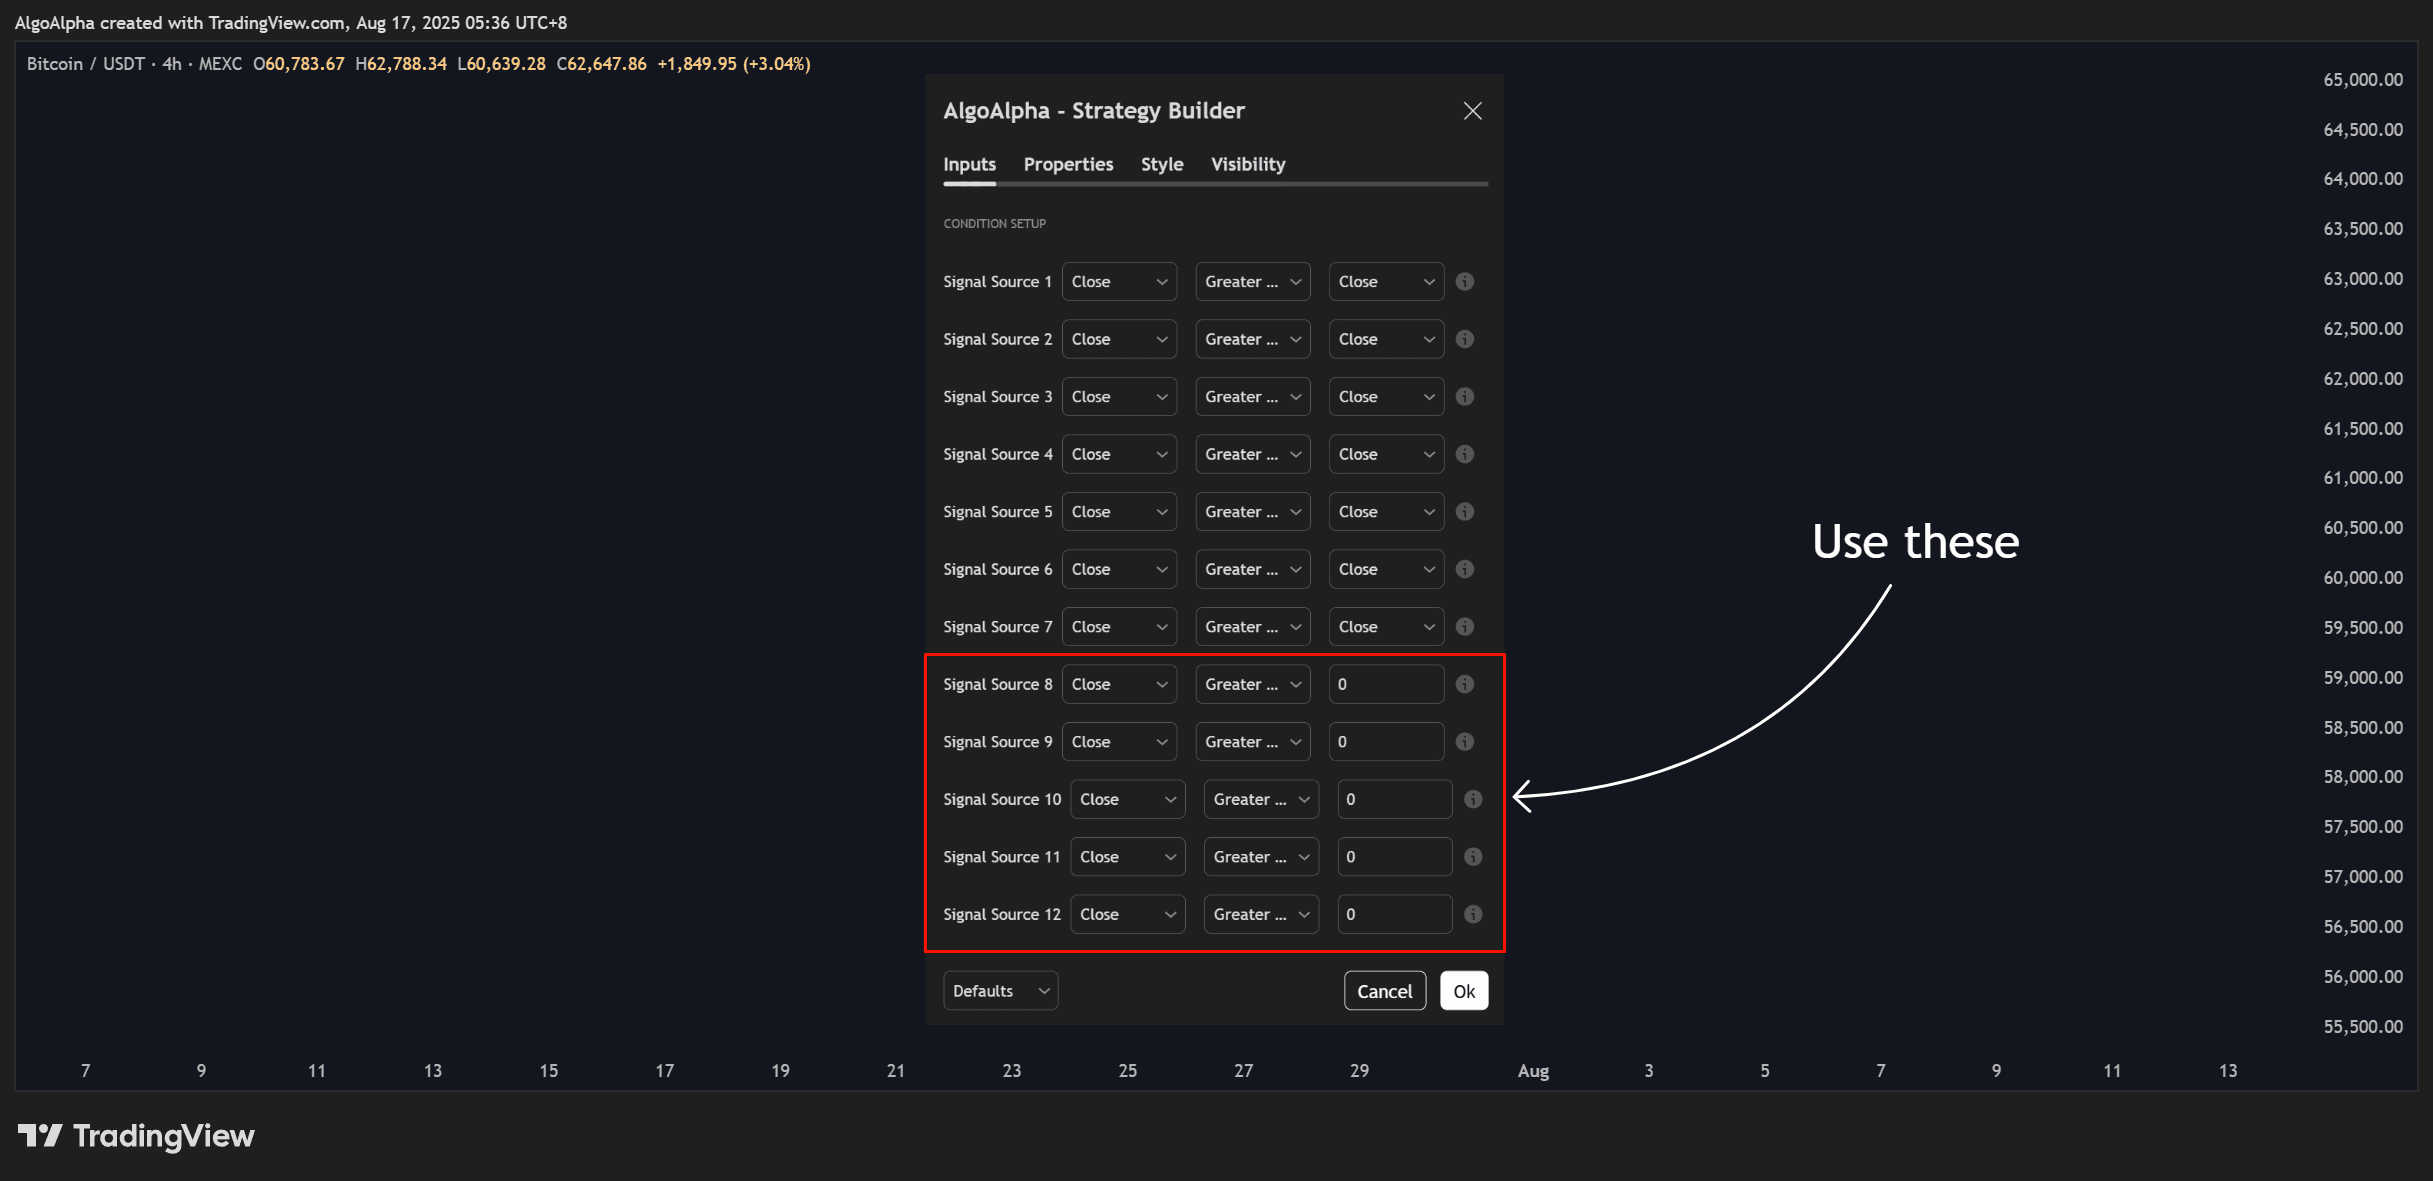
Open the Strategy Builder settings:
- Under Long Entry Conditions, enable:
- SSA Long Signal = On
- ILPAC Bullish BOS = On
- Set the Logic Operator to AND
- Under Short Entry Conditions, leave everything disabled (this example is long-only)
This configuration means a long trade will only open when SSA fires a bullish signal on the same bar that ILPAC detects a bullish Break of Structure.
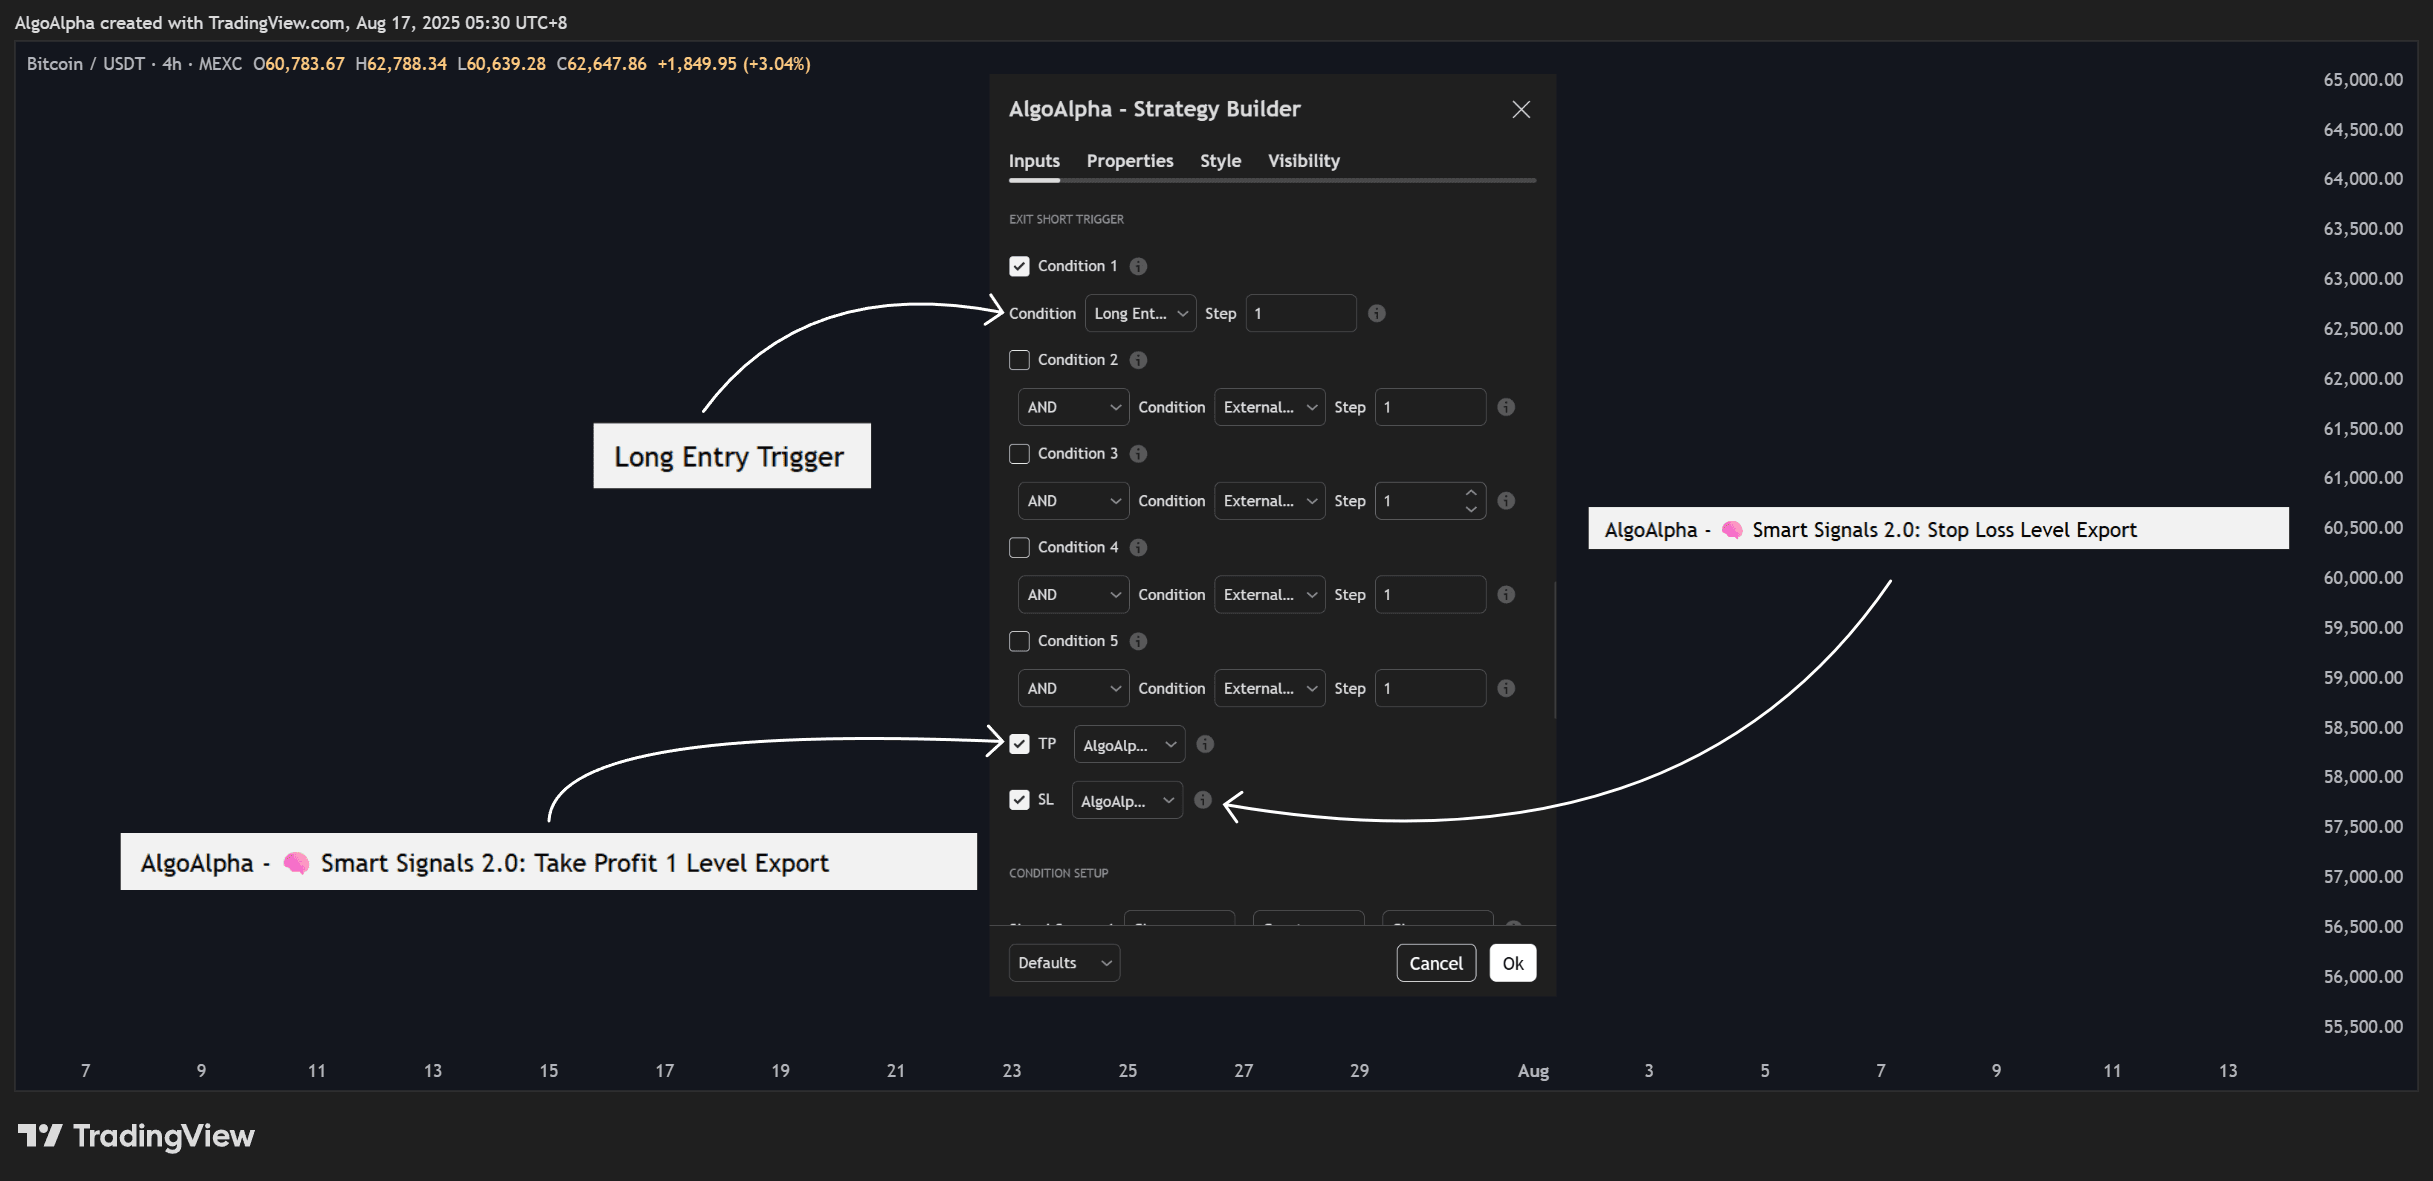
Step 3 — Configure Exit Conditions
- Set Take Profit to 3%
- Set Trailing Stop to 1.5%
- Enable Exit on Opposing Signal — the position will close if SSA generates a bearish (short) signal
- Leave Time-based Exit disabled
Step 4 — Set Trade Parameters
| Parameter | Value |
|---|---|
| Initial Capital | $10,000 |
| Position Size | 10% of equity per trade |
| Leverage | 1x (no leverage) |
| Commission | 0.1% per trade |
| Slippage | 0.05% |
These settings model a conservative approach: no leverage, realistic fees, and a modest position size that allows for multiple concurrent positions if the strategy scales up.
Step 5 — Run and Interpret Results
With the settings applied, the Strategy Tester tab at the bottom of TradingView will show the simulation results. Here is how to interpret what you see:
Checking Key Metrics
Look at the performance summary first:
- Net Profit: Is the strategy profitable after costs? A positive number is the minimum threshold
- Win Rate: For a trend-following strategy, a win rate above 40-50% combined with a favorable risk-reward ratio is typical
- Profit Factor: Above 1.5 is generally considered strong; between 1.0 and 1.5 is marginal
- Max Drawdown: Consider whether you could tolerate this loss psychologically and financially. A 20% drawdown means your account would drop from $10,000 to $8,000 at its worst point
Reviewing the Equity Curve
A healthy equity curve for a trend-following strategy should show:
- An upward trajectory over time, even if not perfectly smooth
- Drawdowns that recover within a reasonable number of bars
- No single trade or cluster of trades responsible for the majority of profits (which would suggest fragility)
Examining Individual Trades
Look at the trade list for patterns:
- Are the biggest winners significantly larger than the biggest losers? (Good — the strategy captures trends)
- Are there long strings of consecutive losses? (Could indicate the strategy struggles in range-bound markets)
- Do the entry points visually make sense when you look at where BOS and SSA signals fired on the chart?
Step 6 — Refine the Strategy
Based on the results, consider adjustments:
If Drawdowns Are Too Large
- Reduce position size from 10% to 5% of equity
- Tighten the trailing stop from 1.5% to 1.0%
- Add a Momentum Concepts filter — for example, only enter when the Momentum Impulse histogram is also positive
If There Are Too Few Trades
- Change the logic from AND to OR (SSA long signal OR ILPAC Bullish BOS)
- Lower the swing length on ILPAC to detect more BOS events
- Test on a lower timeframe (e.g., 1-hour instead of 4-hour)
If the Strategy Works on BTCUSDT but Not Other Assets
- The strategy may be overfit to BTC's price behavior
- Test on at least 3-5 different assets (e.g., ETHUSDT, SOLUSDT, SPX) to confirm robustness
- If results are inconsistent, add more general filters or reduce the number of conditions
No backtest guarantees future performance. Historical results are a guide, not a guarantee. Always start with small position sizes when trading a new strategy with real capital.
Key Takeaways
- Start with a simple hypothesis (two conditions with AND logic) and add complexity only if needed
- Always include commission and slippage for realistic results
- Pay attention to max drawdown and consecutive losses, not just net profit
- Test across multiple assets and timeframes to avoid overfitting
- Iterate gradually — change one parameter at a time and observe the impact