Smart Signals
How the Smart Signals engine generates buy and sell signals on your chart.
Smart Signals are the core output of the Smart Signals Assistant. They represent the indicator's primary buy and sell recommendations based on its analysis of price action, trend, and momentum.
Signal Types
The SSA generates two main signal categories:
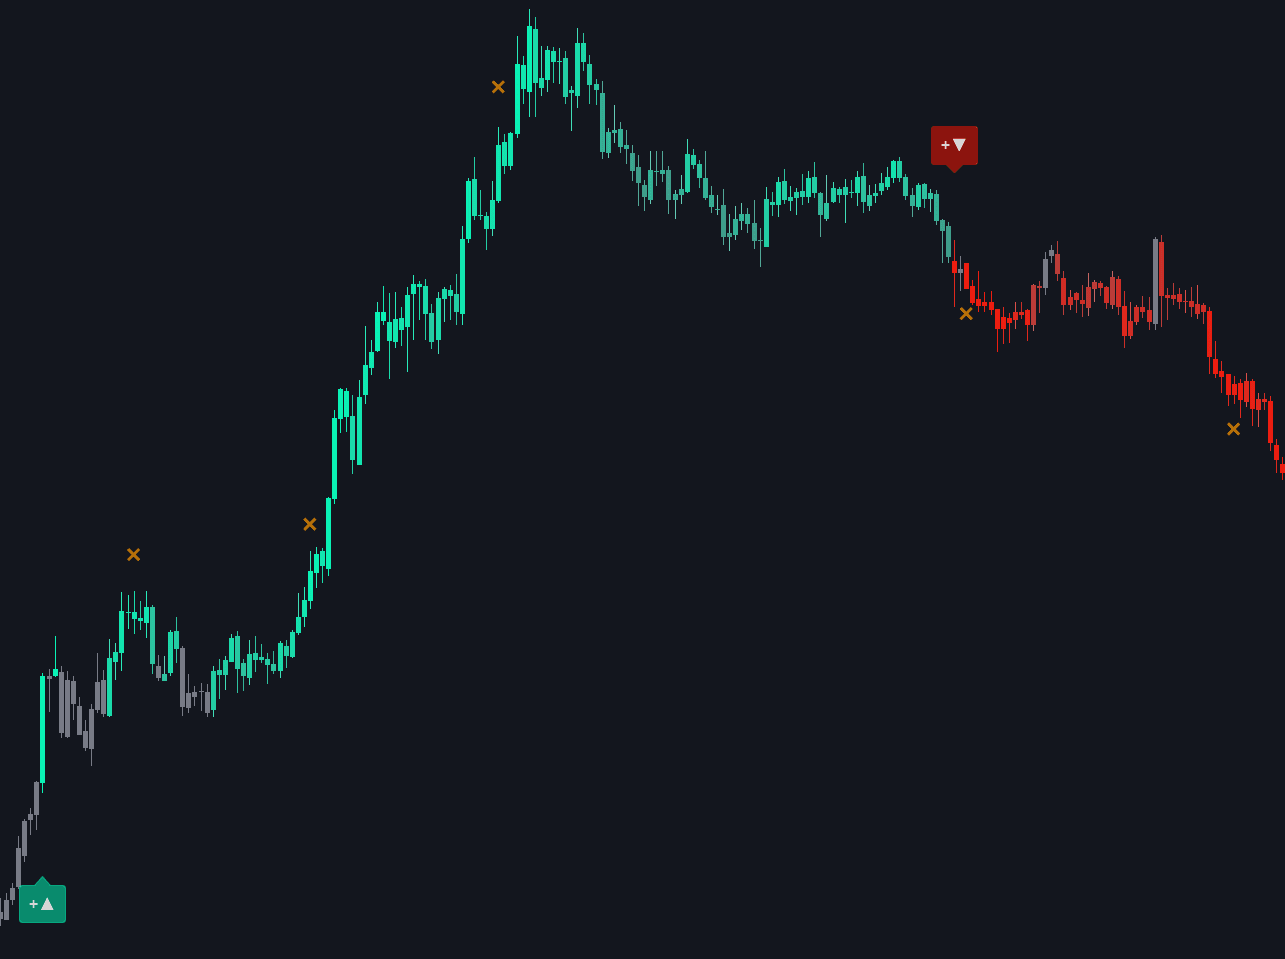
Buy Signals
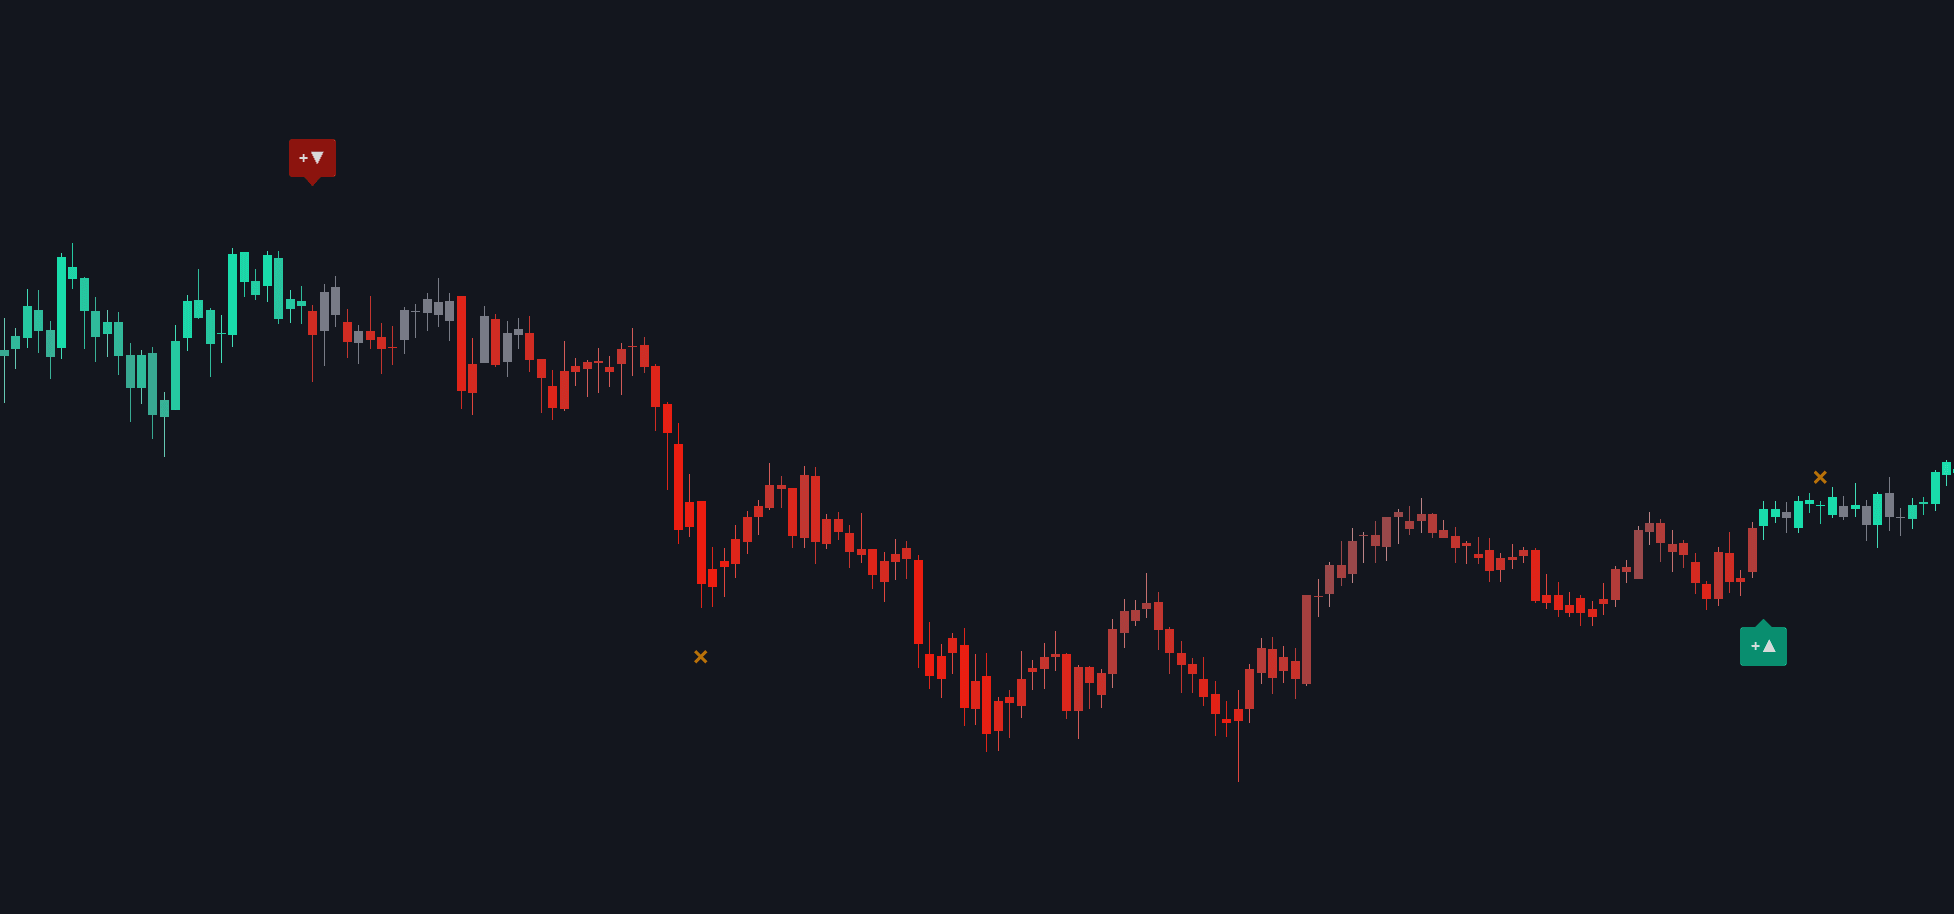
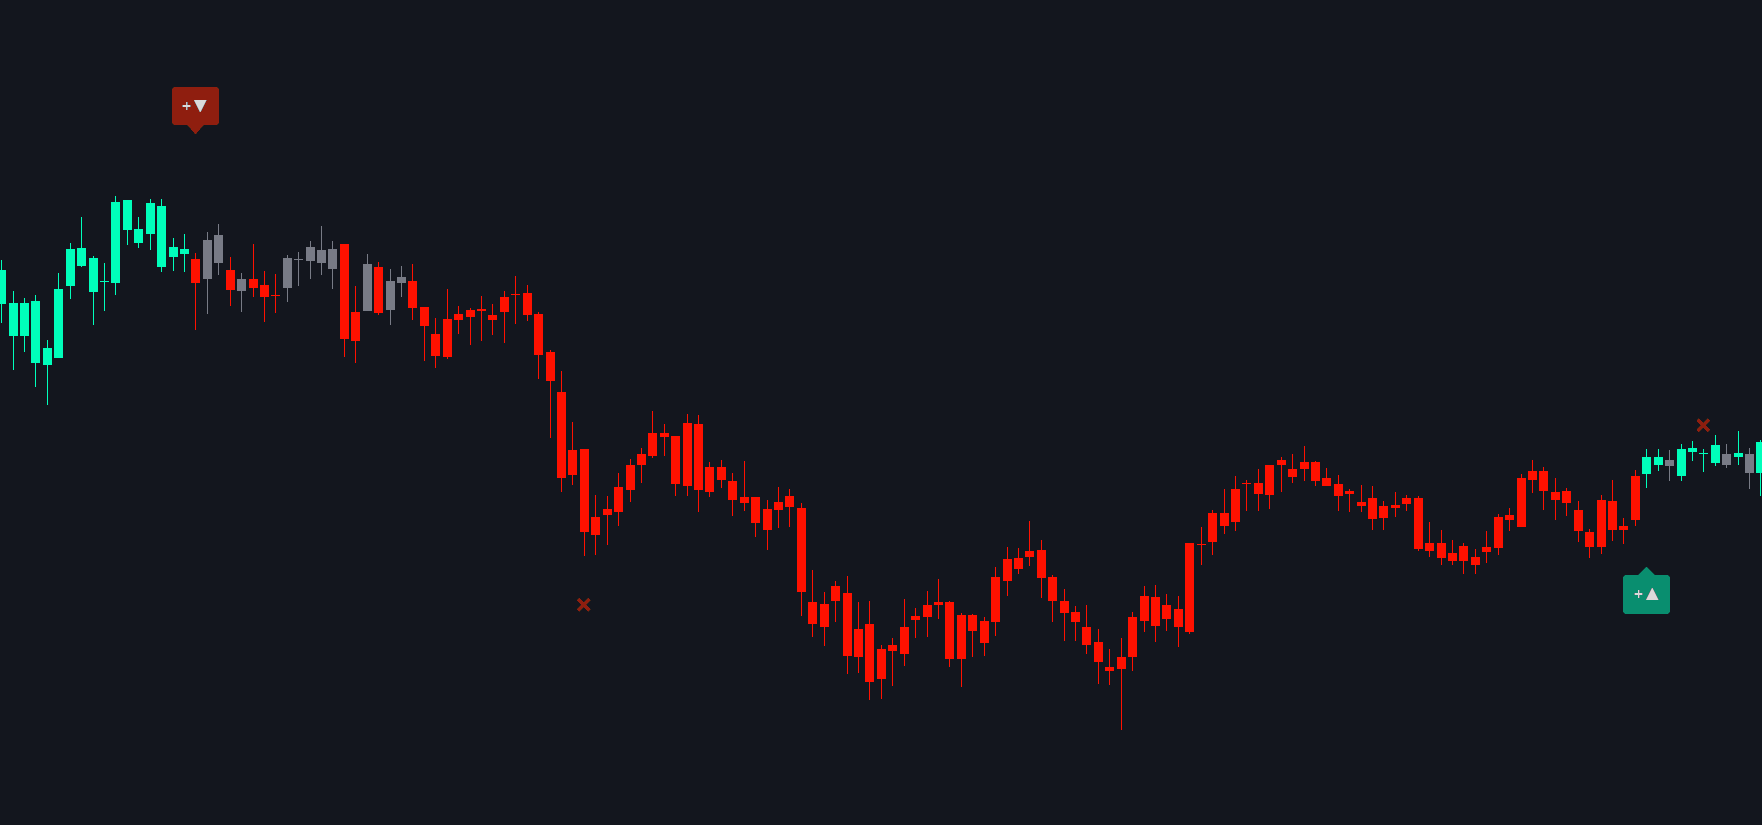
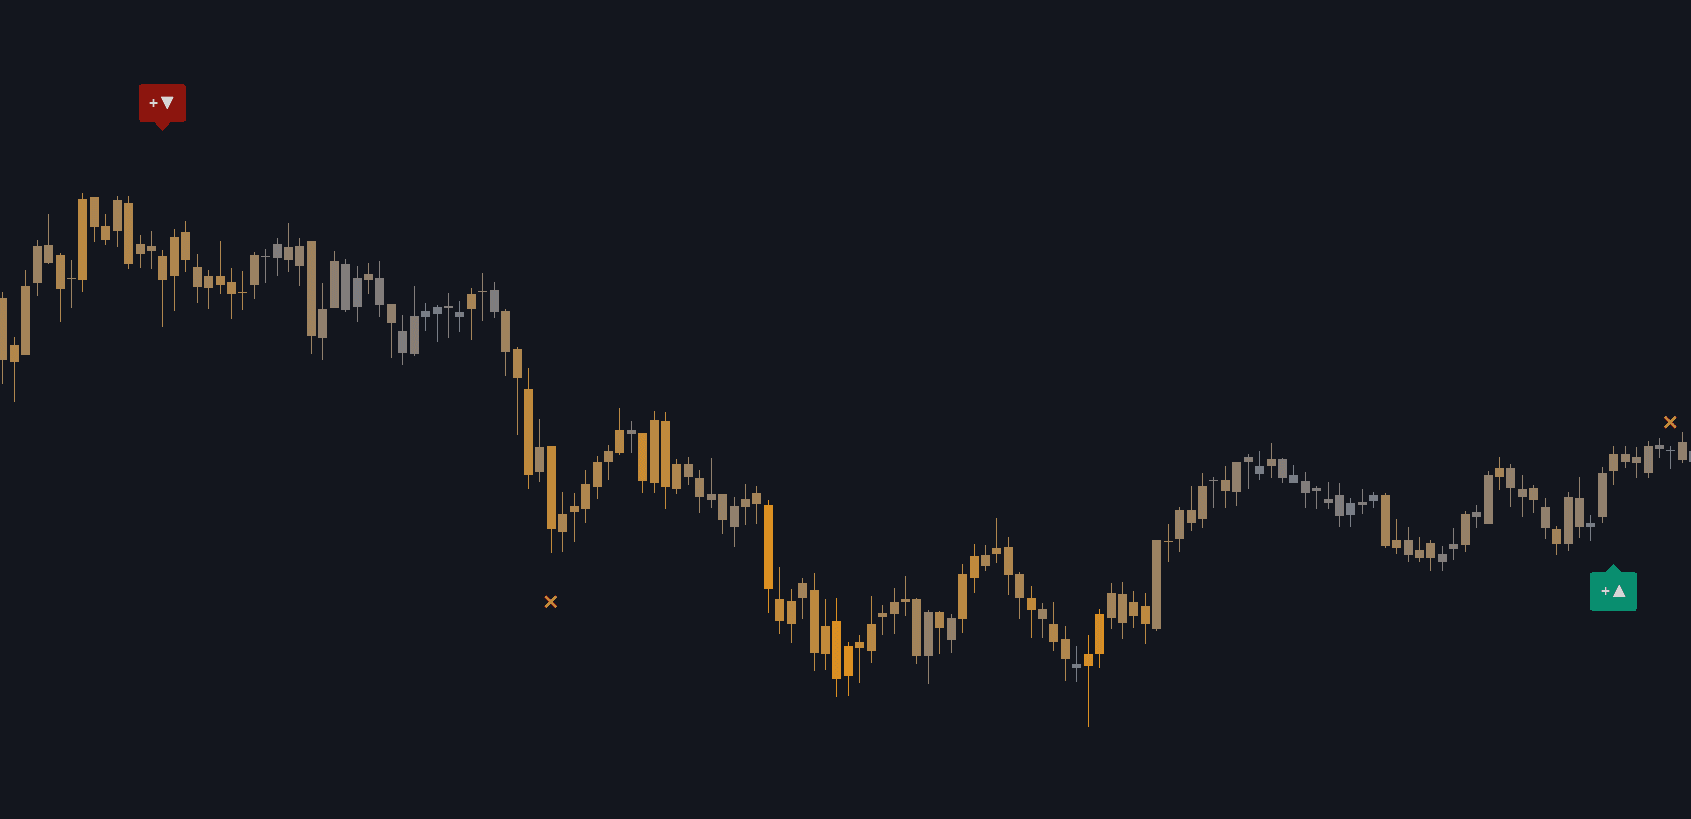
Buy signals appear as green markers (typically triangles or arrows) below price bars. They indicate that the indicator's algorithm has detected conditions favorable for a long entry, such as:
- A shift from bearish to bullish momentum
- A pullback to a support level within an uptrend
- A reversal pattern after an extended decline
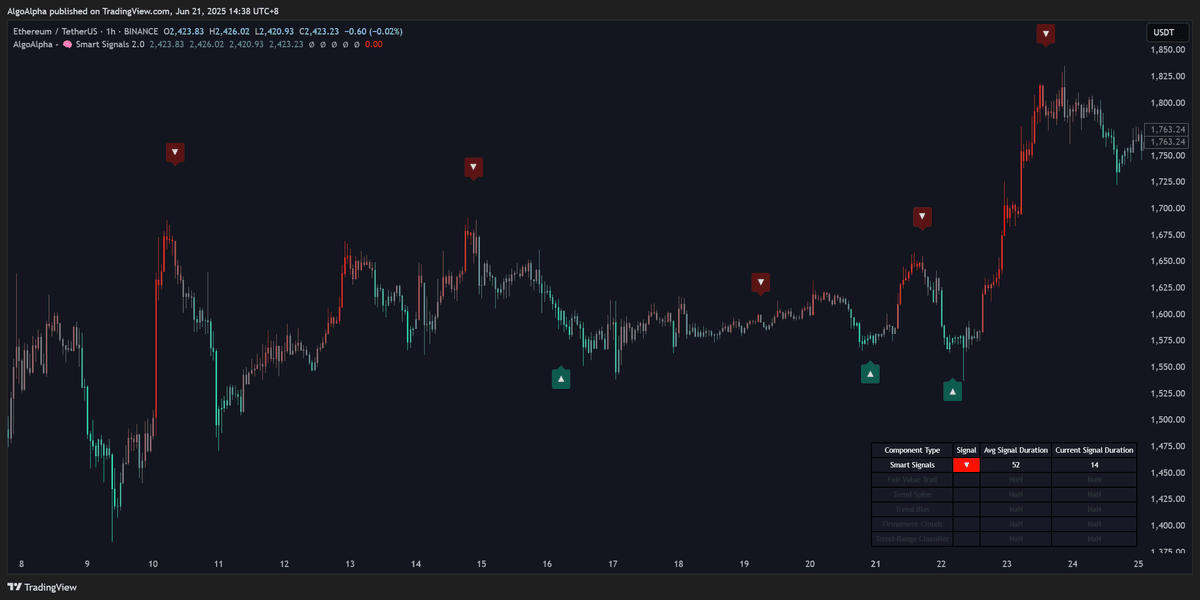
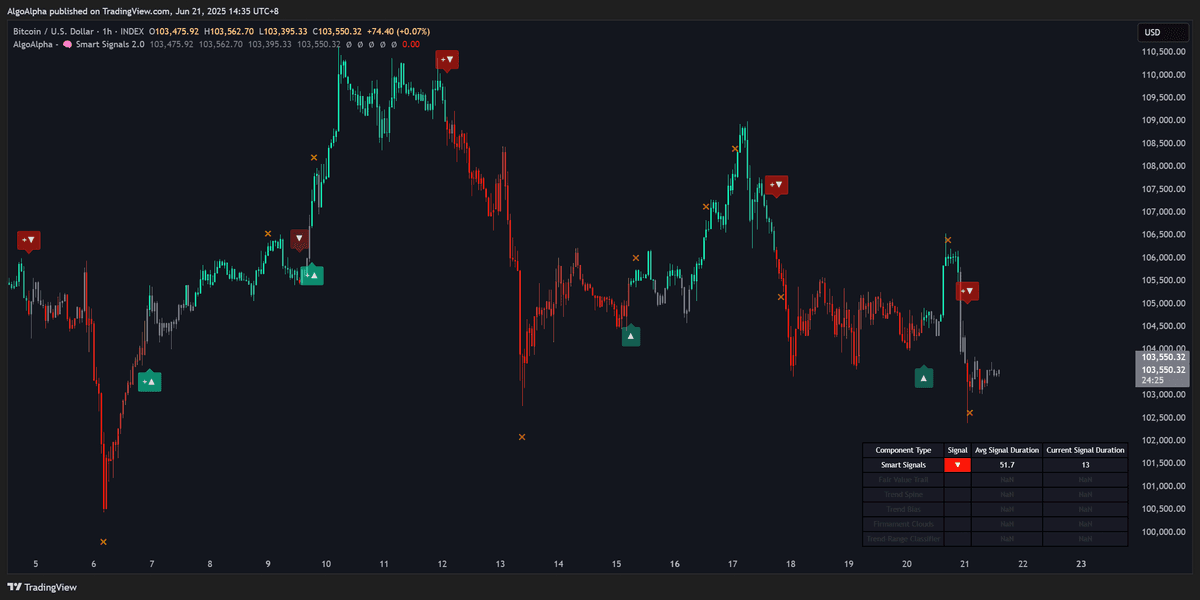
Sell Signals
Sell signals appear as red markers above price bars. They indicate conditions favorable for a short entry or closing a long position:
- A shift from bullish to bearish momentum
- A rejection at a resistance level within a downtrend
- A reversal pattern after an extended rally
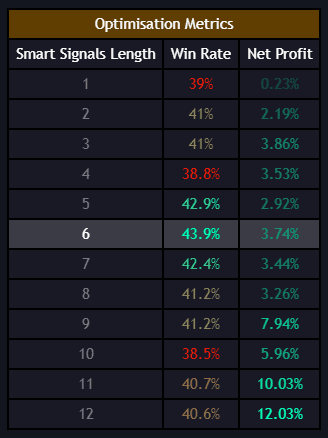
Signal Strength
Not all signals carry the same weight. The SSA uses confluence from its internal modules to assess signal quality:
- Strong signals — Appear when multiple internal conditions align (trend, momentum, and volume confirmation)
- Standard signals — Appear when the primary conditions are met but with less confluence
Strong signals are visually distinguished on the chart (typically larger or differently colored markers). They generally have a higher probability of success.
How to Use Smart Signals
As Entry Triggers
The most straightforward use is to enter a trade when a signal appears:
- Wait for a buy signal on your preferred timeframe
- Check that the signal has confluence support (see Confluence Components)
- Enter the position and set your stop-loss below the recent swing low
- Use Smart Exits to manage your exit
As Confirmation for Existing Analysis
If you already have a trading strategy, Smart Signals can serve as a confirmation layer:
- Only take your setup when it aligns with an SSA signal in the same direction
- Use the signal timing to refine your entry point
- Filter out trades where the SSA is signaling the opposite direction
Multi-Timeframe Approach
For higher-confidence entries, use signals across multiple timeframes:
- Identify the trend direction on a higher timeframe (e.g., 4H or Daily)
- Wait for a signal on a lower timeframe (e.g., 15m or 1H) in the same direction
- This alignment between timeframes increases the probability of a successful trade
Avoid trading against the higher-timeframe trend. If the Daily chart is bearish, focus on sell signals on lower timeframes rather than buy signals.
Signal Frequency and Sensitivity
The frequency of signals depends on:
- Timeframe — Lower timeframes generate more signals; higher timeframes generate fewer but potentially more significant ones
- Sensitivity setting — Adjustable in the indicator settings. Higher sensitivity produces more signals (but with more noise); lower sensitivity produces fewer, higher-quality signals
- Market conditions — Trending markets produce cleaner signals; choppy/ranging markets may generate more false signals
Adjust the sensitivity parameter in the Settings Reference to match your trading style.