
FOMO Bubbles
How ILPAC detects and visualizes retail overextension and potential exhaustion zones using FOMO Bubble signals.
FOMO Bubbles are a visual exhaustion detection system built into ILPAC. They identify moments when price has moved aggressively beyond fair value — typically driven by retail fear-of-missing-out (FOMO) behavior — and flag these as potential reversal or pullback zones.
What Causes a FOMO Bubble?
A FOMO Bubble is triggered when several conditions converge:
- Volume spike: Trading volume surges well above its recent average, indicating a rush of new orders
- Price deviation: Price moves multiple standard deviations away from its fair value or mean
- Momentum exhaustion: Despite the aggressive move, the rate of change in price begins to slow, suggesting the buying or selling pressure is weakening
When all three conditions are present, ILPAC plots a FOMO Bubble on the chart at the candle where the detection occurred.
How to Read FOMO Bubbles
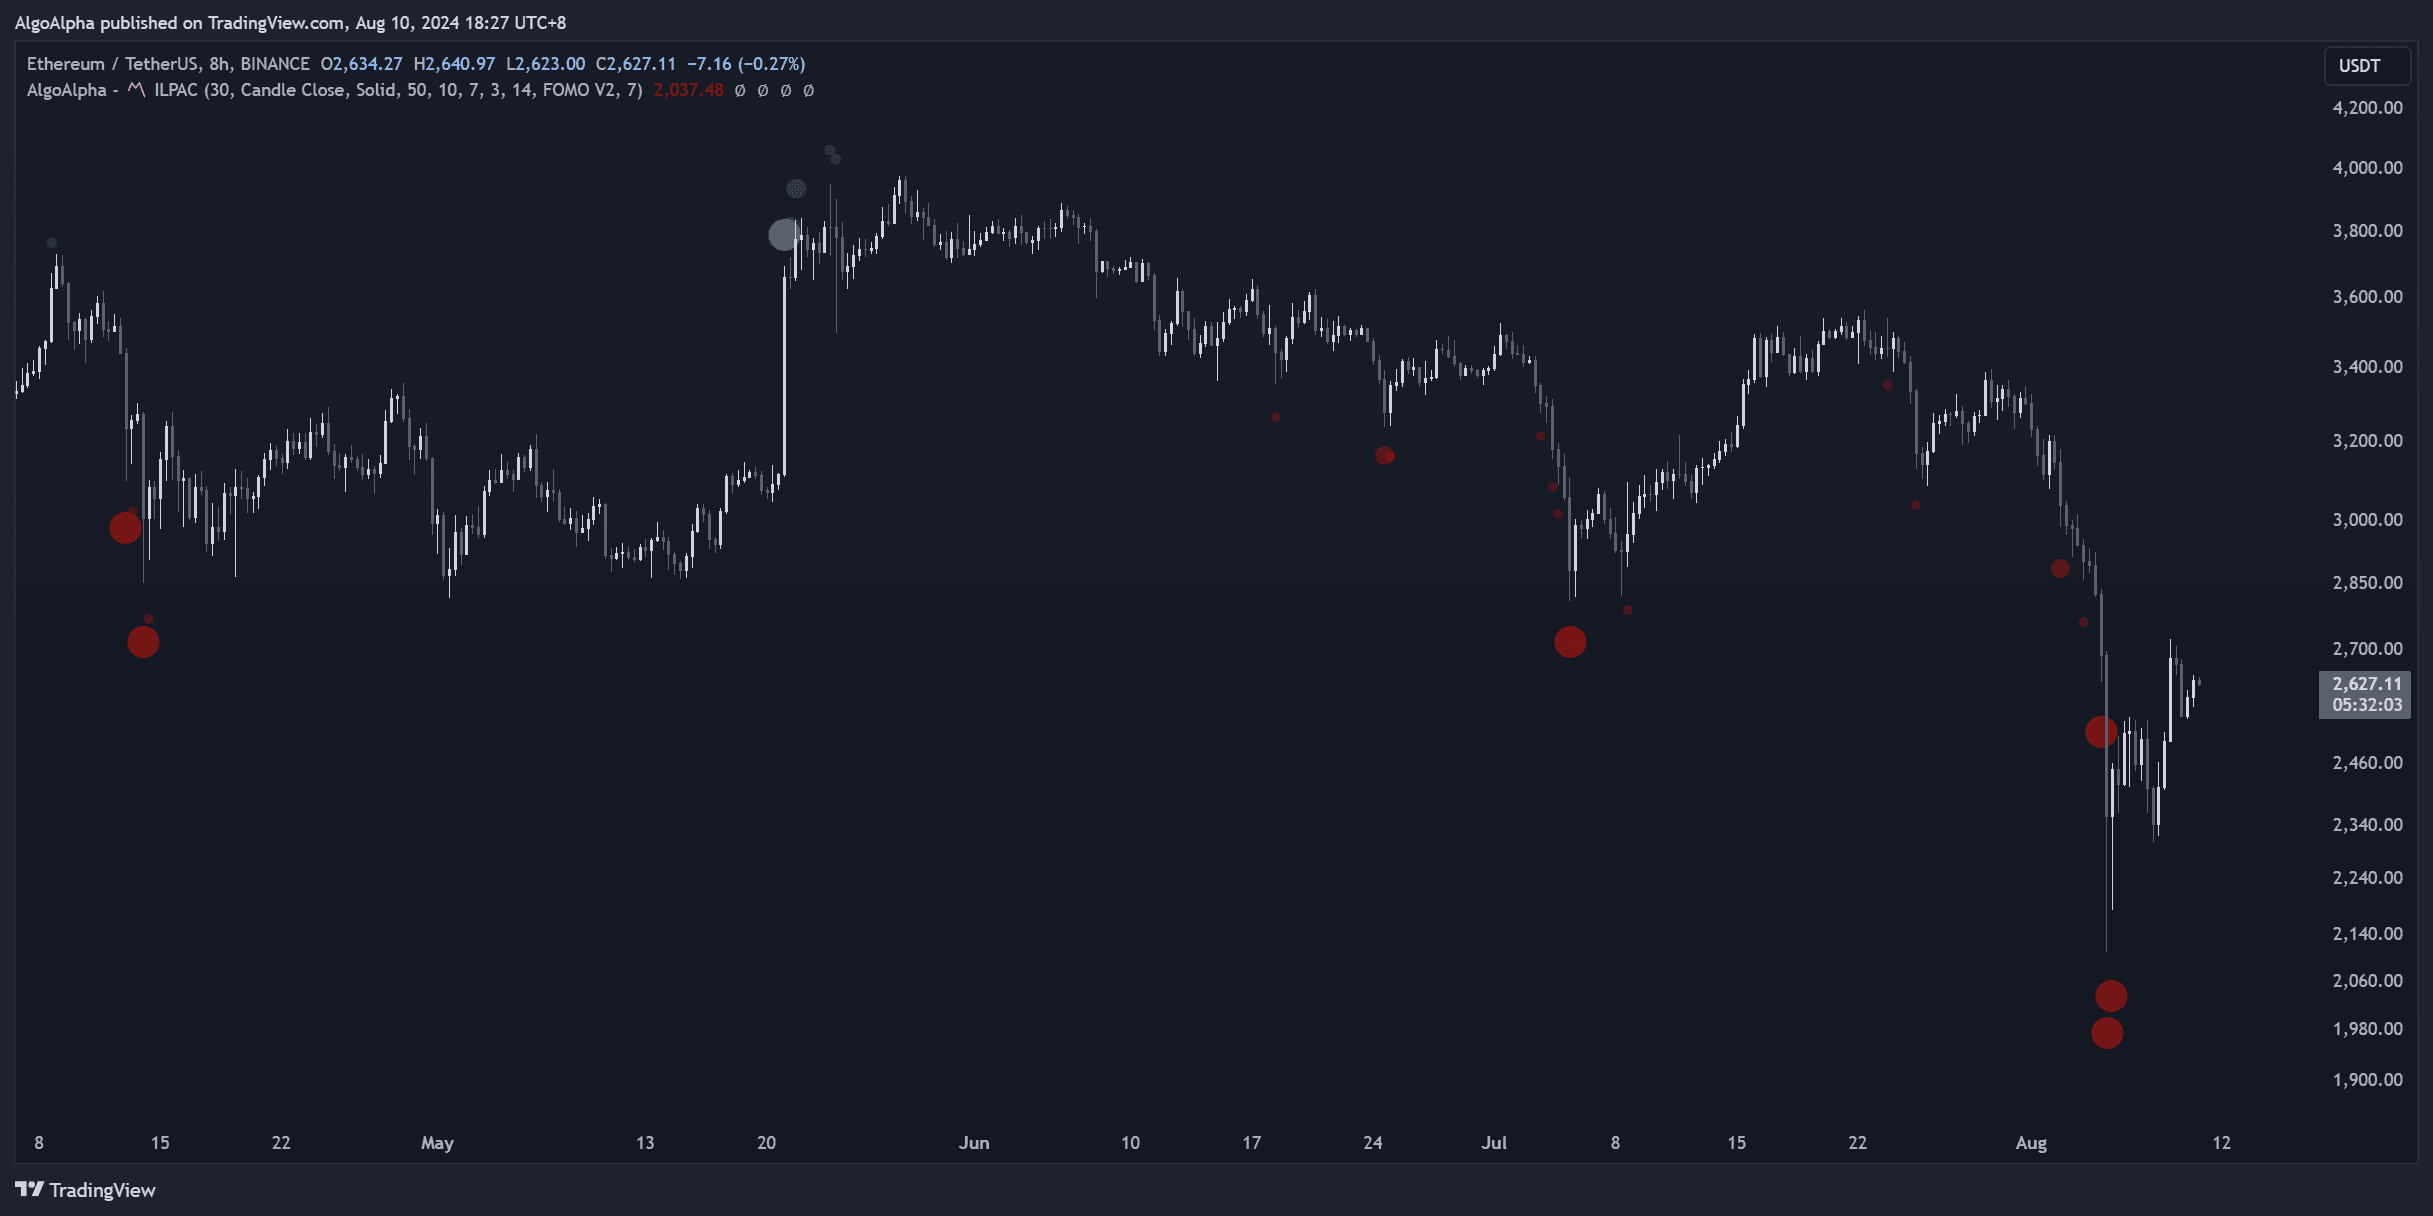
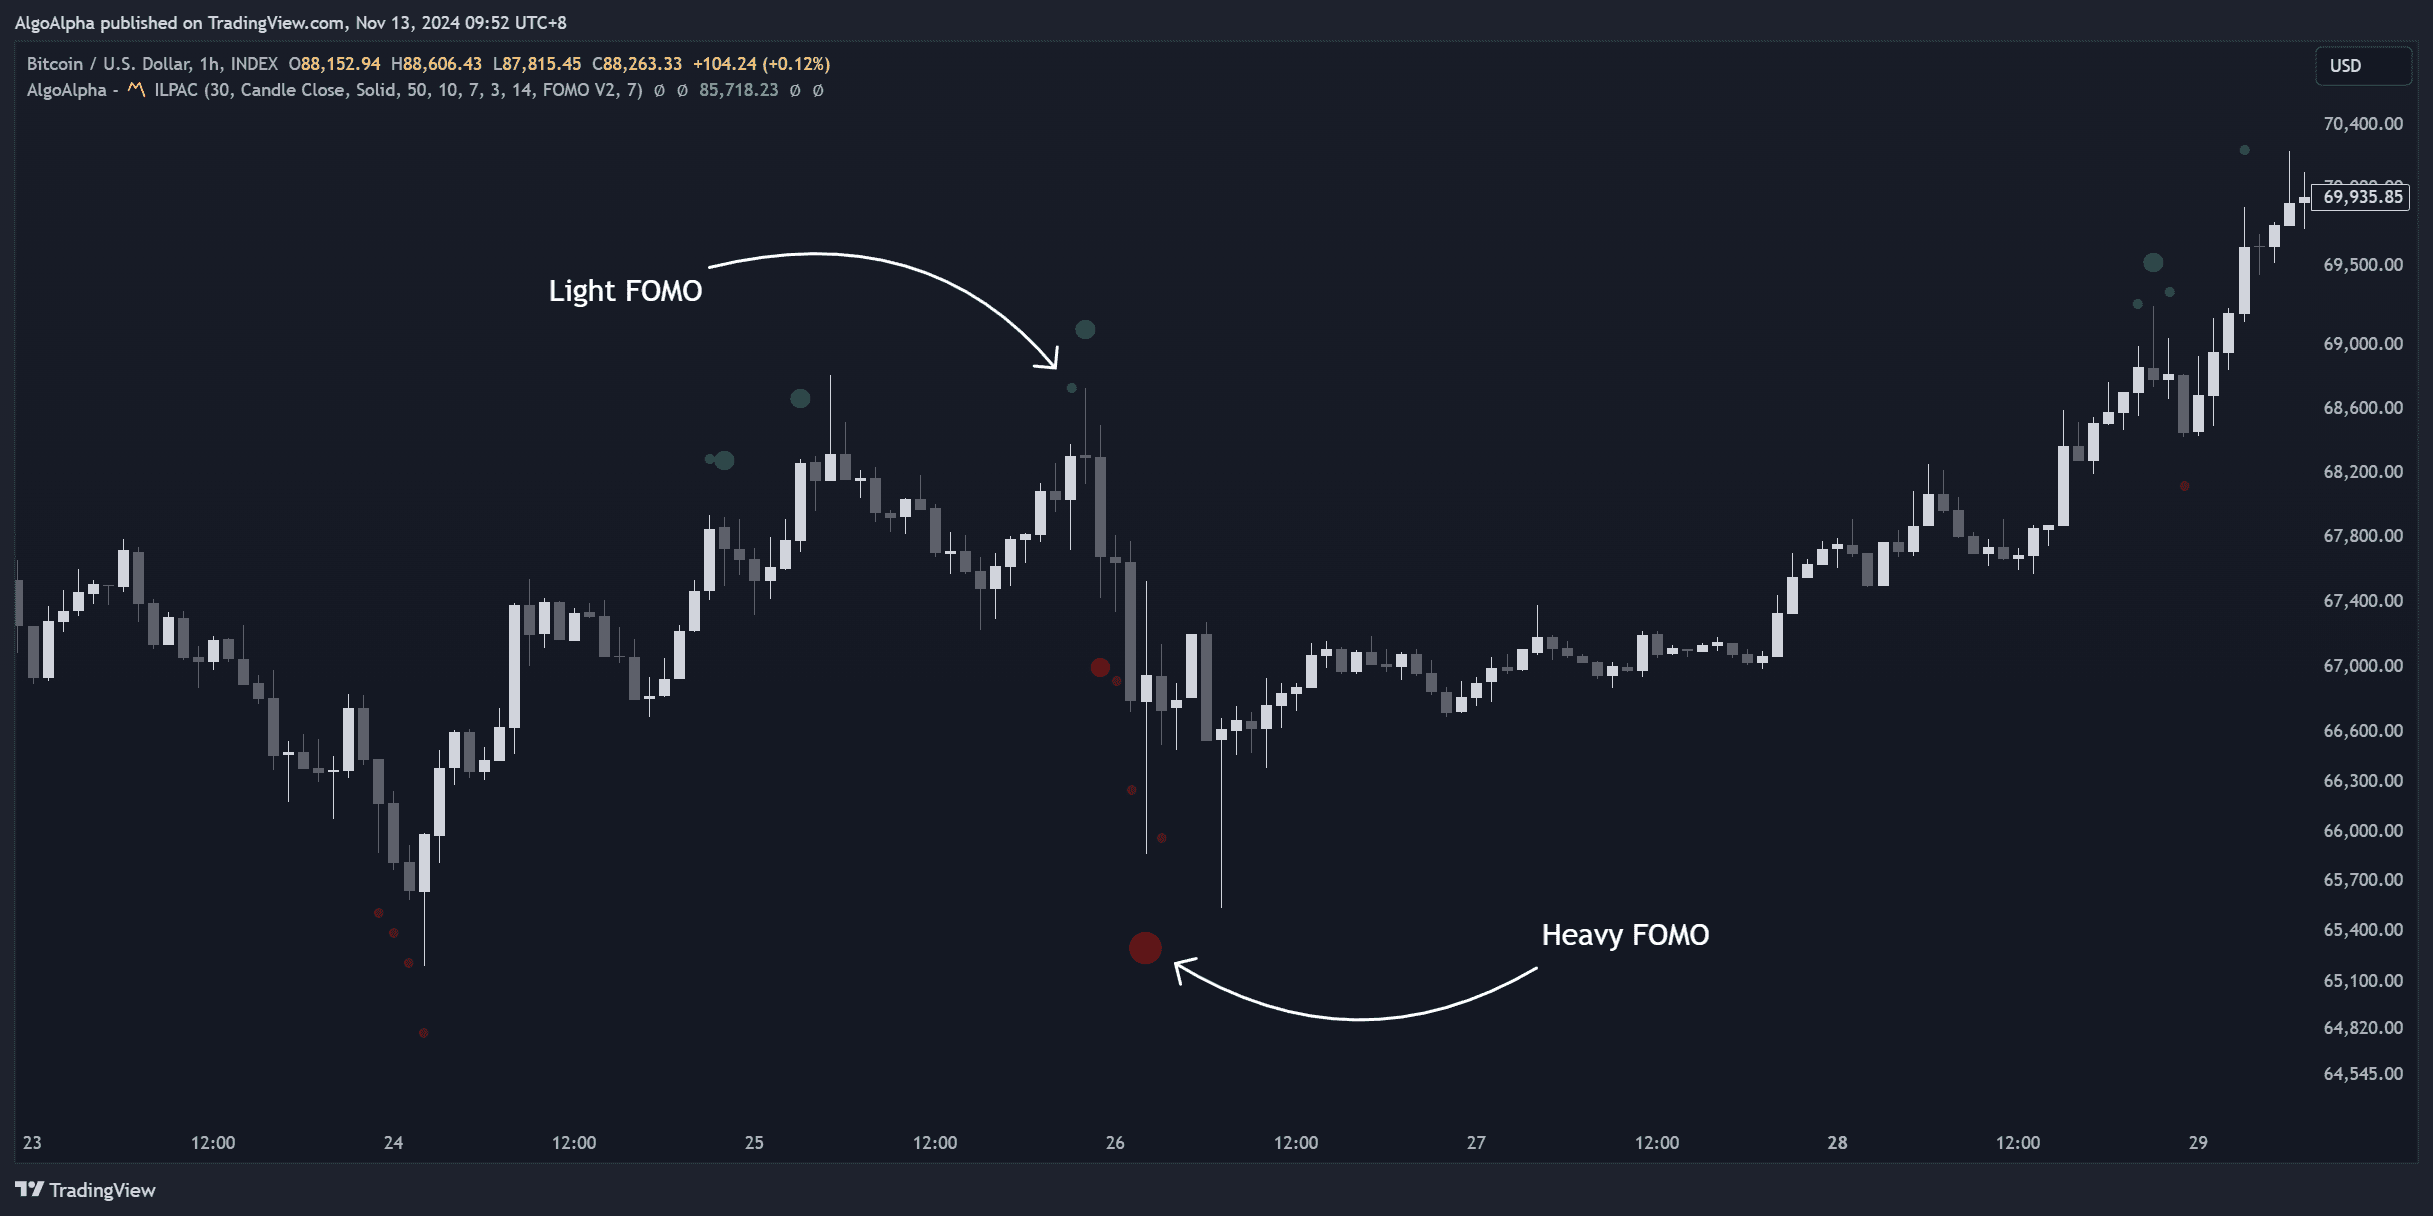
FOMO Bubbles appear as visual markers (typically circles or highlighted zones) directly on the price chart:
| Signal | Meaning |
|---|---|
| Bullish FOMO Bubble (at a price peak) | The rally has overextended — price is far above fair value with declining momentum. A pullback or reversal is more likely than continuation. |
| Bearish FOMO Bubble (at a price trough) | The selloff has overextended — price is far below fair value with declining momentum. A bounce or reversal is more likely than continuation. |
FOMO Bubbles are not guaranteed reversal signals. They indicate that the current move is statistically overextended. Always combine them with other confirmation tools like Market Structure (CHoCH) or support/resistance zones.
Trading with FOMO Bubbles
Avoiding Late Entries
The primary use of FOMO Bubbles is to prevent you from entering a move that has already exhausted its momentum. When you see a breakout and feel the urge to chase it, a FOMO Bubble appearing on that candle tells you the move is likely overcooked.
Mean-Reversion Setups
FOMO Bubbles can serve as the basis for mean-reversion trades:
- A FOMO Bubble appears at the end of an aggressive move
- Wait for confirmation — a CHoCH event, a bearish engulfing candle, or a return below a key level
- Enter in the opposite direction of the FOMO move, targeting a return toward fair value
- Place your stop-loss beyond the extreme of the FOMO Bubble candle
Exit Signal
If you are already in a position and a FOMO Bubble appears in your trade's direction, consider tightening your stop or taking partial profits. The bubble signals that the move powering your trade may be running out of steam.
Confluence with the Liquidation Heatmap
FOMO Bubbles that appear near dense liquidation zones are particularly significant. The combination suggests that the aggressive move was fueled by liquidation cascades and is unlikely to sustain further in the same direction.
How FOMO Bubbles Differ from Overbought/Oversold
Traditional overbought/oversold indicators (like RSI above 70 or below 30) measure momentum in isolation. FOMO Bubbles incorporate volume analysis, price deviation from a dynamic fair value, and momentum deceleration — providing a more nuanced read on whether a move is truly exhausted rather than simply extended.
Settings
| Setting | Description |
|---|---|
| Show FOMO Bubbles | Toggle FOMO Bubble detection on or off |
| Sensitivity | Adjusts the threshold for how far price must deviate and how strong the volume spike must be to trigger a bubble |
| Bubble Style | Customize the visual appearance of bubble markers |
| Bubble Colors | Set separate colors for bullish and bearish FOMO Bubbles |
See the Settings Reference for all options.