
Market Structure
How ILPAC detects and labels Break of Structure (BOS) and Change of Character (CHoCH) events on your chart.
The Market Structure module is the foundation of ILPAC. It automatically identifies and labels the key swing points that define a trend — higher highs, higher lows, lower highs, and lower lows — then detects two critical structural events: Break of Structure (BOS) and Change of Character (CHoCH).
What Is Market Structure?
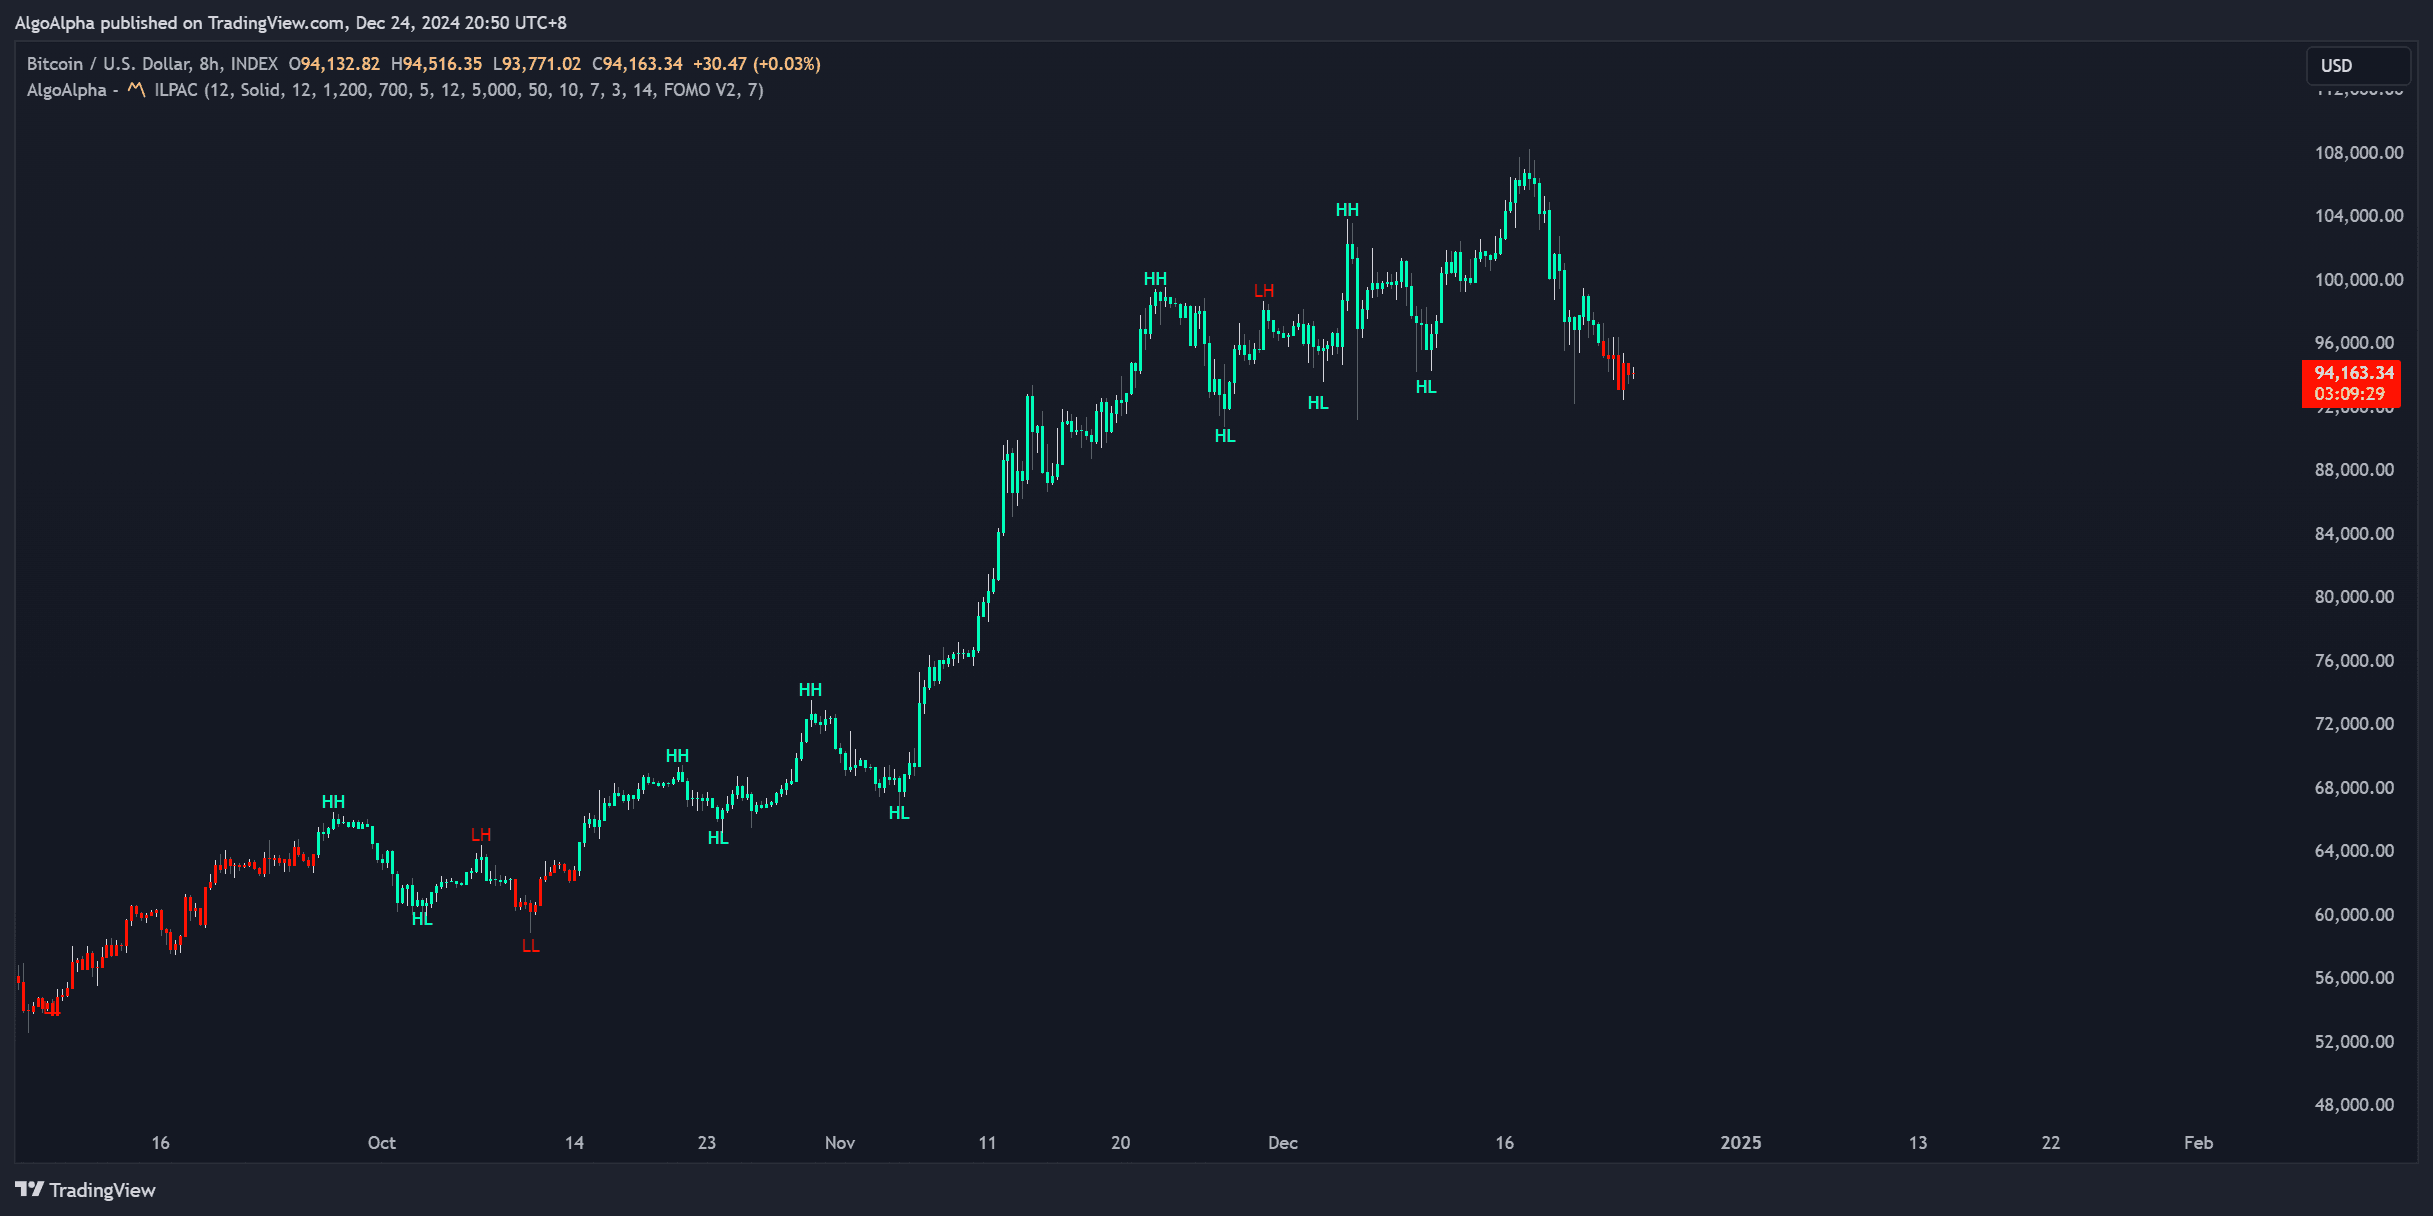
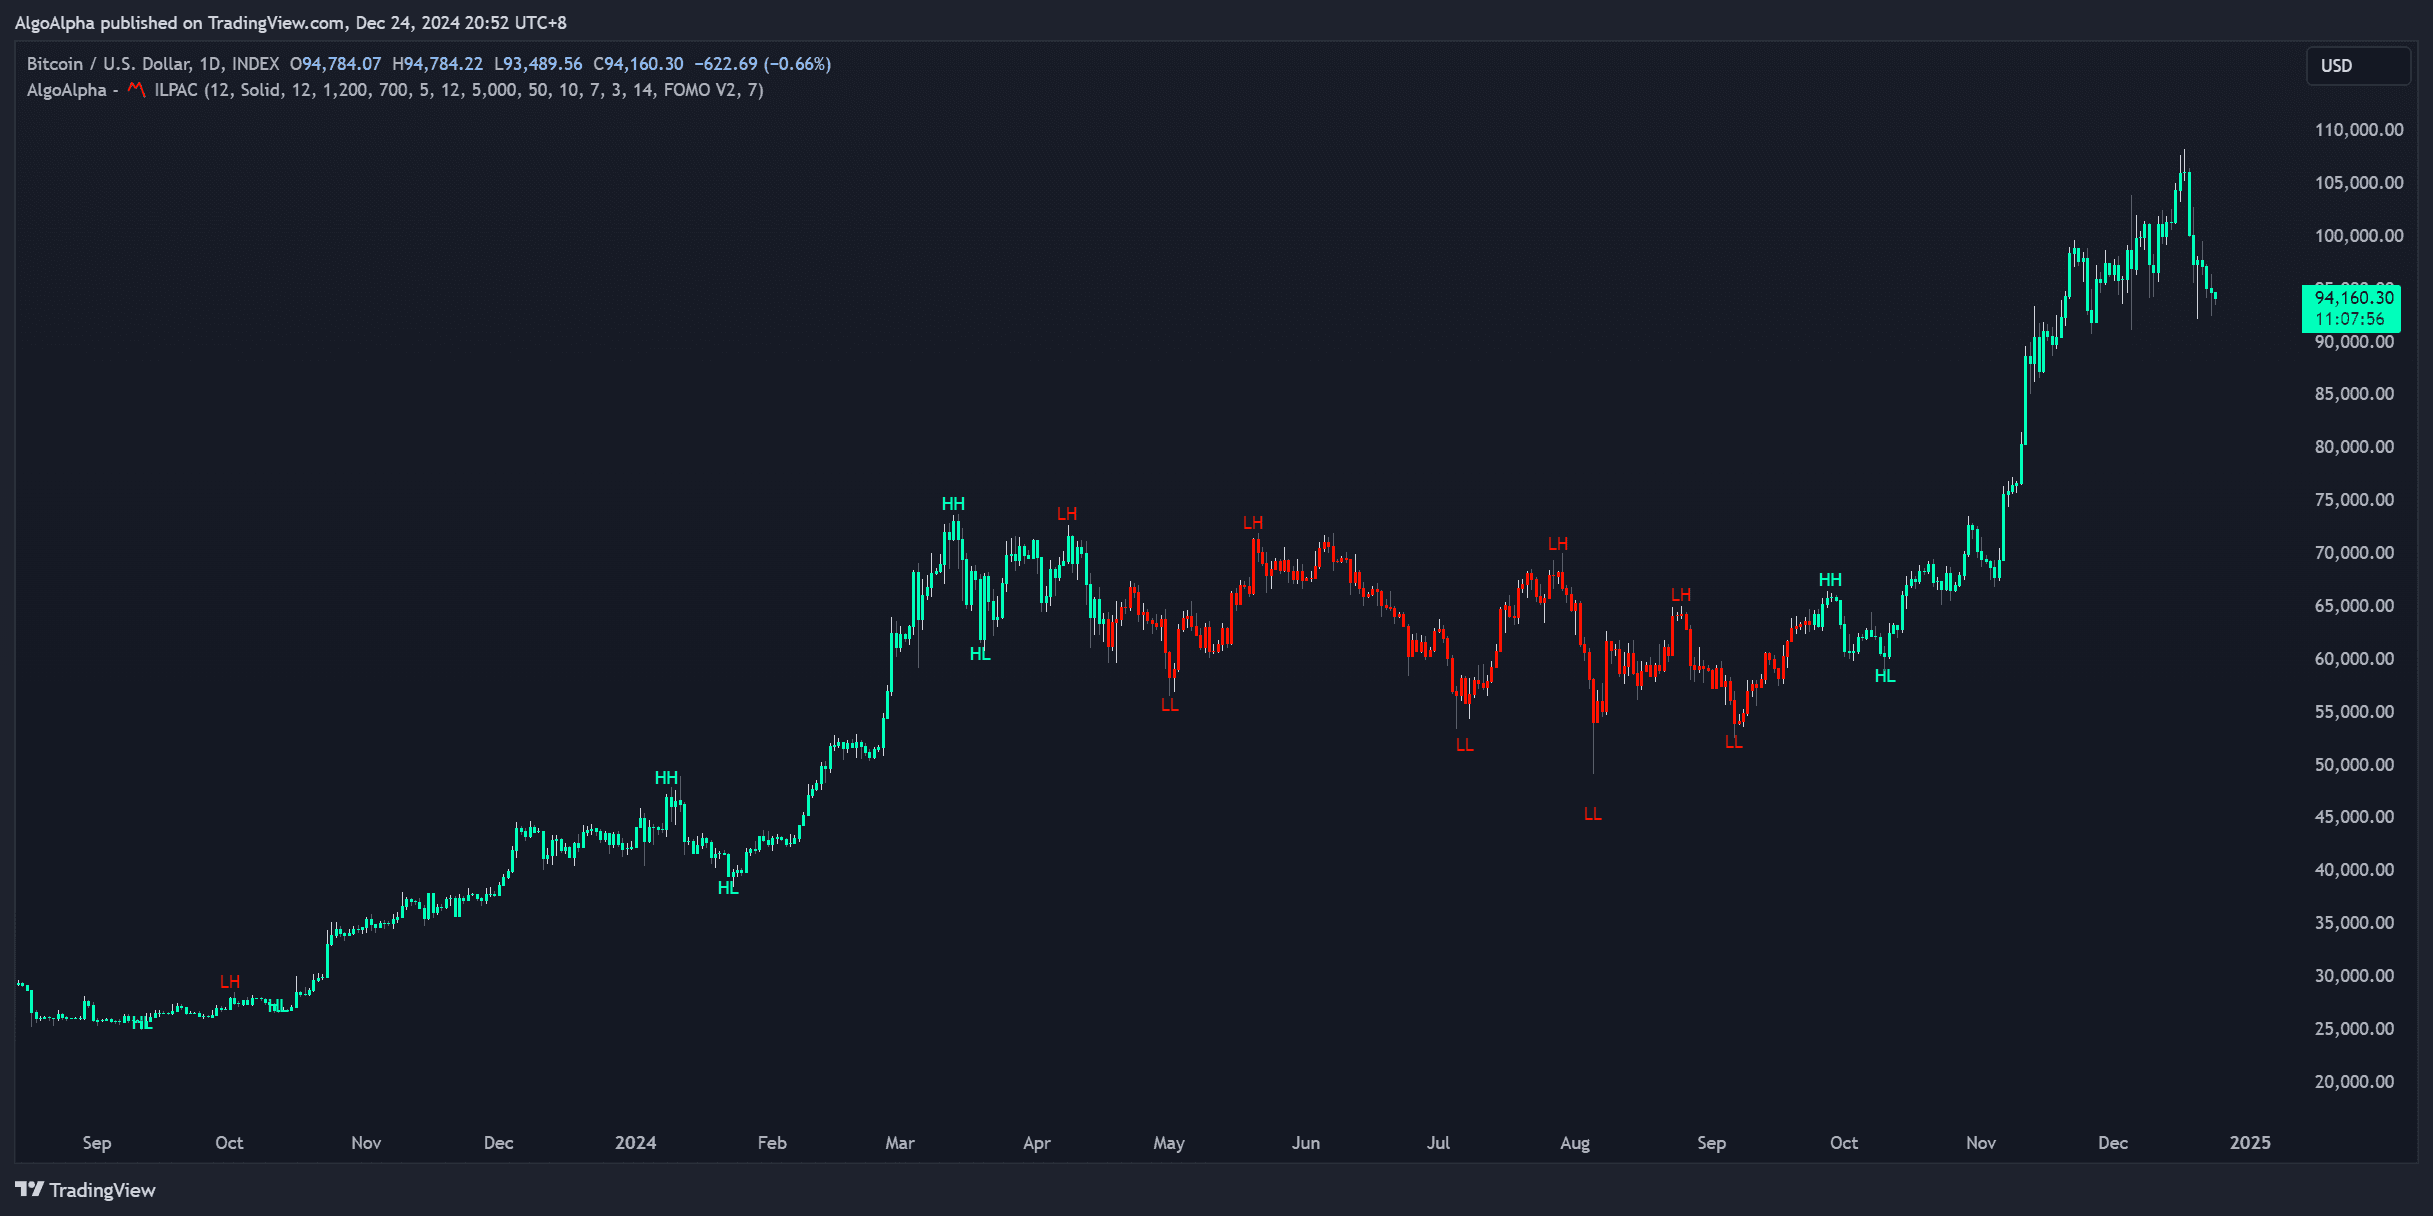
In price action analysis, market structure refers to the pattern of swing highs and swing lows that price forms over time. A bullish trend is defined by a series of higher highs (HH) and higher lows (HL). A bearish trend is defined by lower highs (LH) and lower lows (LL).
ILPAC automates this process by scanning for swing pivots and labeling them on your chart.
Break of Structure (BOS)
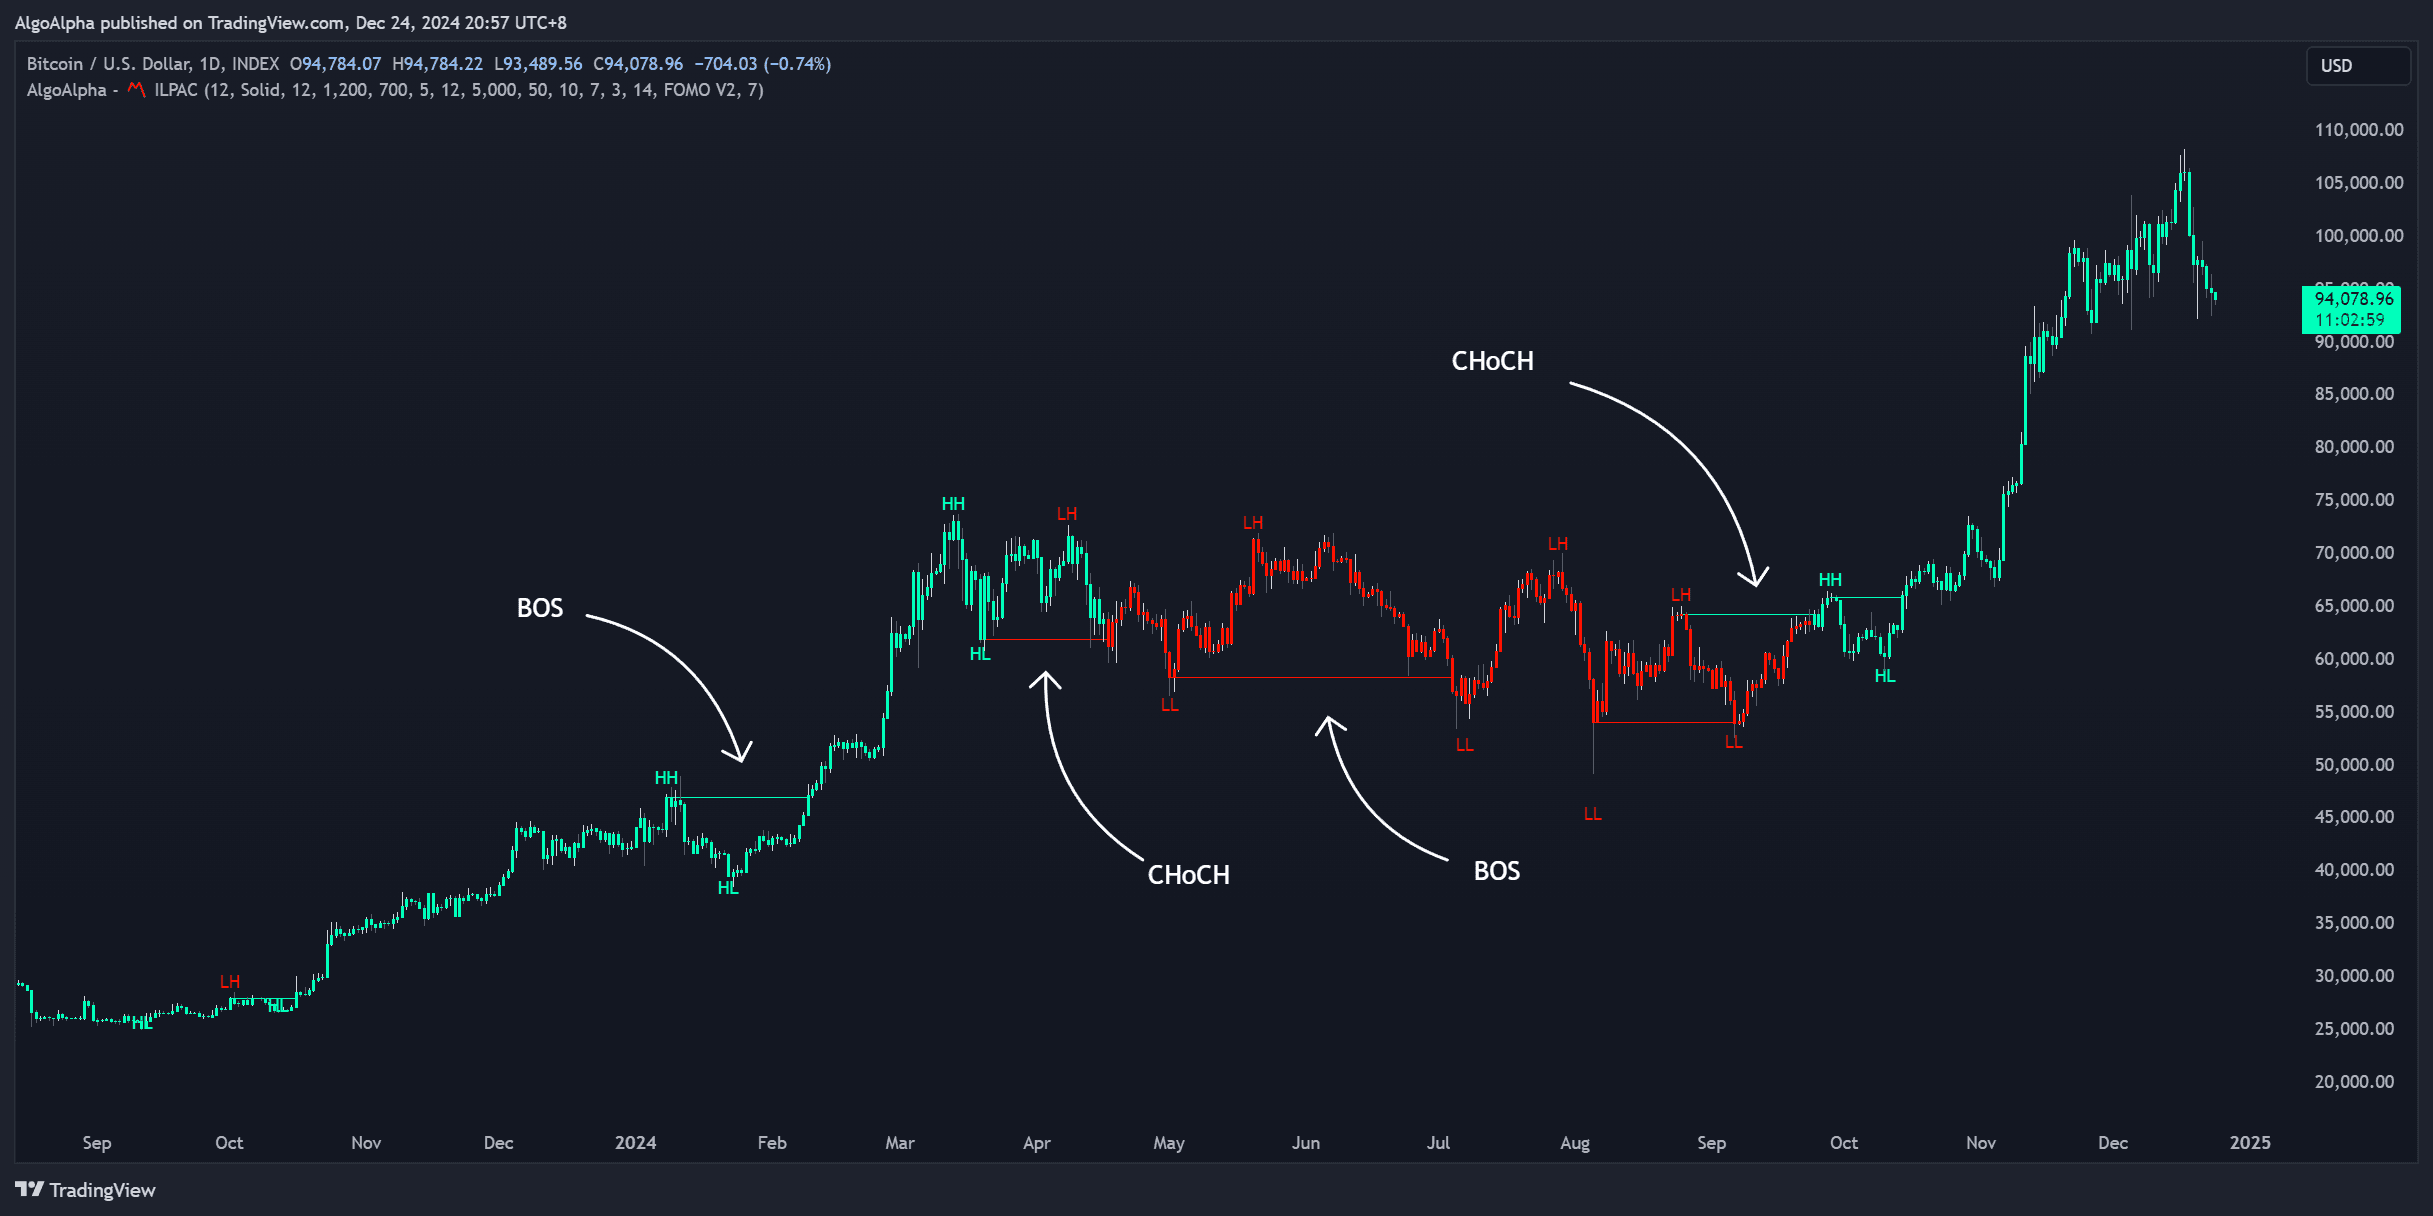
A Break of Structure occurs when price breaks beyond the most recent swing point in the direction of the existing trend. It confirms that the current trend is continuing with momentum.
- Bullish BOS: Price breaks above the most recent swing high during an uptrend
- Bearish BOS: Price breaks below the most recent swing low during a downtrend
When a BOS is detected, ILPAC draws a horizontal line at the broken level and labels it on the chart. This gives you visual confirmation that the trend is intact.
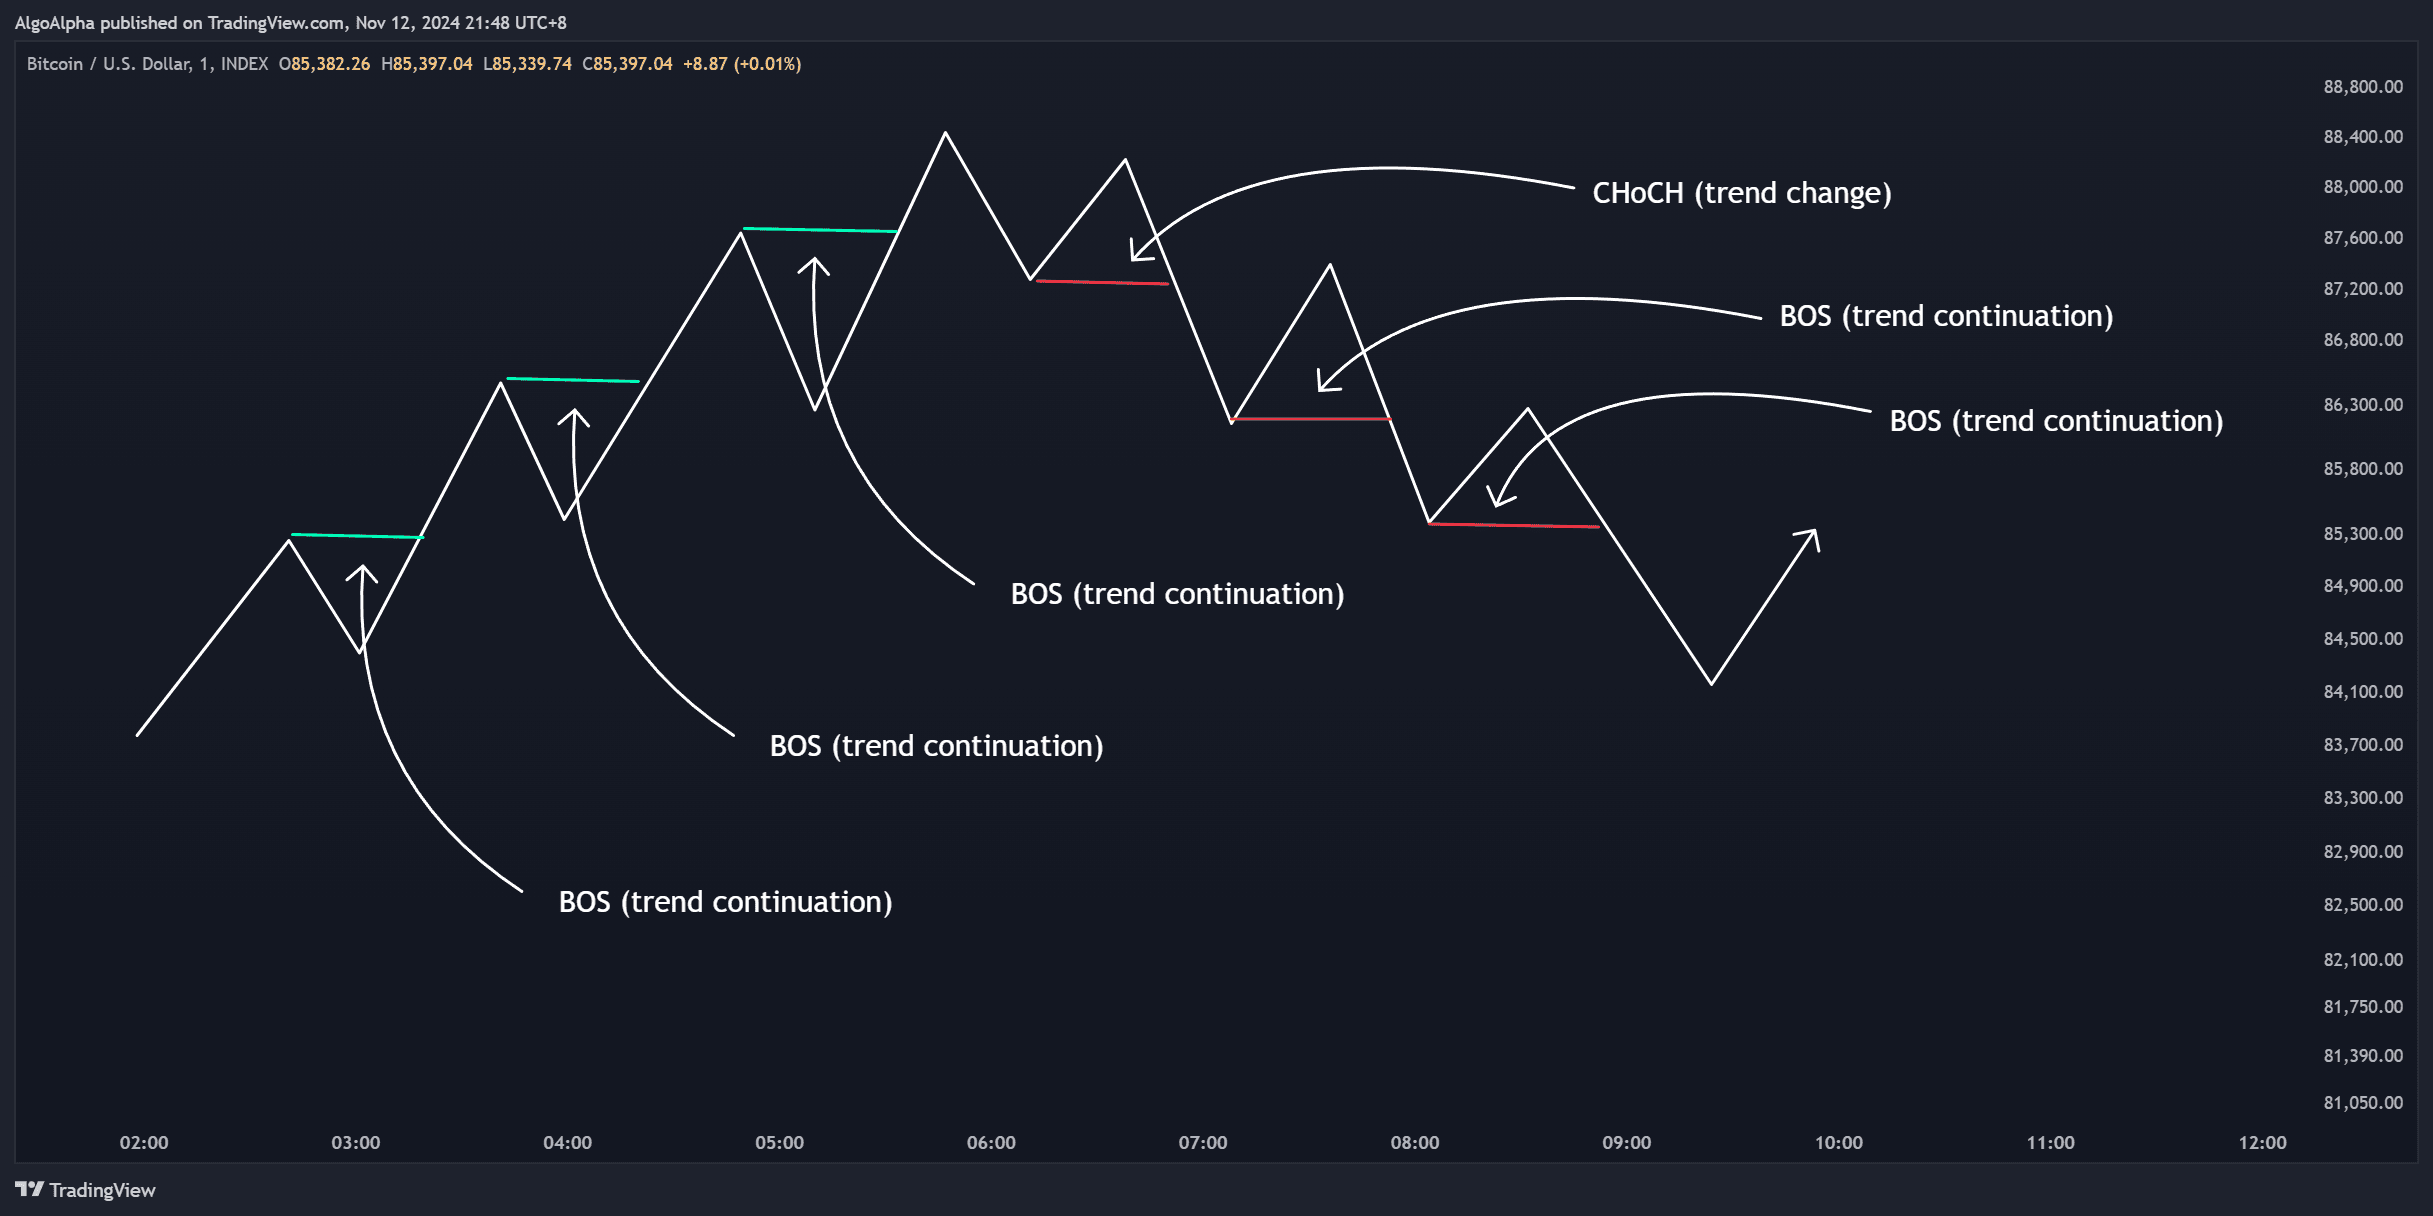
Change of Character (CHoCH)
A Change of Character is the opposite — it signals that the prevailing trend may be reversing. CHoCH occurs when price breaks a swing point in the direction against the current trend.
- Bullish CHoCH: During a downtrend, price breaks above the most recent swing high, suggesting a potential shift to bullish
- Bearish CHoCH: During an uptrend, price breaks below the most recent swing low, suggesting a potential shift to bearish
CHoCH is considered a leading signal — it often appears before a full trend reversal is confirmed by additional BOS events in the new direction.
Swing Labels
ILPAC places swing labels directly on the chart at each identified pivot point:
| Label | Meaning |
|---|---|
| HH | Higher High — a new swing high above the previous swing high |
| HL | Higher Low — a new swing low above the previous swing low |
| LH | Lower High — a new swing high below the previous swing high |
| LL | Lower Low — a new swing low below the previous swing low |
These labels update in real time as new candles form and pivot points are confirmed.
Configuring Swing Sensitivity
The Swing Length setting controls how many bars on each side of a pivot are required to confirm it as a swing point. This directly affects how frequently BOS and CHoCH events are detected:
- Lower values (e.g., 3-5): More swing points detected, more frequent BOS/CHoCH labels — suitable for scalping and short-term trading
- Higher values (e.g., 10-20): Fewer but more significant swing points — suitable for swing trading and position trading
Increasing the swing length filters out minor price fluctuations and focuses on more meaningful structural shifts. Start with the default and adjust based on your timeframe and strategy.
Trading Applications
Trend Continuation with BOS
When you see a BOS label, the trend is confirmed to be continuing. Common approaches:
- Wait for a BOS event in your favored direction
- Enter on the next pullback to the broken structure level (which now acts as support or resistance)
- Place your stop-loss beyond the most recent swing point on the opposite side
Reversal Trading with CHoCH
When a CHoCH appears, it warns that the trend may be turning. A typical reversal workflow:
- Spot a CHoCH event after an extended trend
- Wait for confirmation — such as a BOS in the new direction or confluence from FOMO Bubbles
- Enter in the new trend direction with a stop-loss beyond the CHoCH level
Combining with Other ILPAC Modules
Market Structure becomes more powerful when layered with other ILPAC components:
- Liquidation Heatmap: Enter at BOS levels that coincide with high-liquidity zones for higher-probability setups
- FOMO Bubbles: A CHoCH that occurs alongside a FOMO exhaustion signal strengthens the reversal case
- Trend Lines: A BOS that also breaks an algorithmic trendline provides additional structural confirmation